BEV Registrations Up 28% in 2020
Updated CT EV Registration Files
Post by Barry Kresch
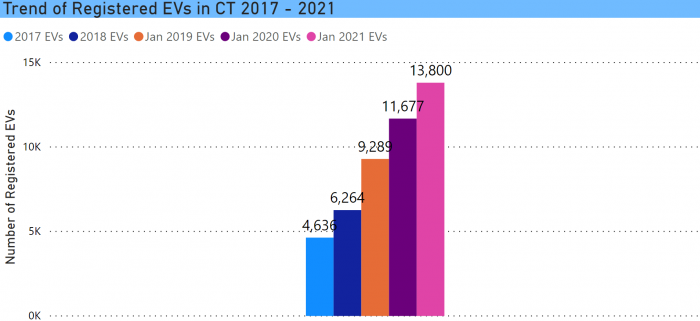
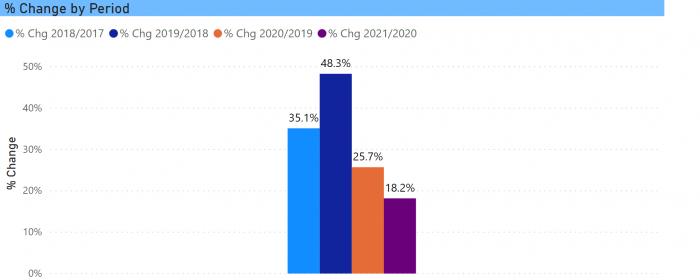
2020 was a difficult year to say the least with overall domestic automobile sales sliding 15% from 2019. Against that background, EV registrations in CT (a related, but different, metric) edged up 18.2% to 13,800 EVs of all stripes. EVs are defined the way they are by the state as battery electric vehicles (BEV), plug-in hybrids (PHEV), battery electric motorcycles (BEMC), and fuel cell electric vehicles (FCEV). The growth rate was slower than in the prior two years, which were 25.7% and 47.8% respectively. It is roughly that last rate of growth from 2 years ago that is needed on a consistent basis if the state is to hit the goal in the Zero Emission Vehicle Memorandum of Understanding. At this rate, CT falls further behind every year.
BEVs Lead the Way
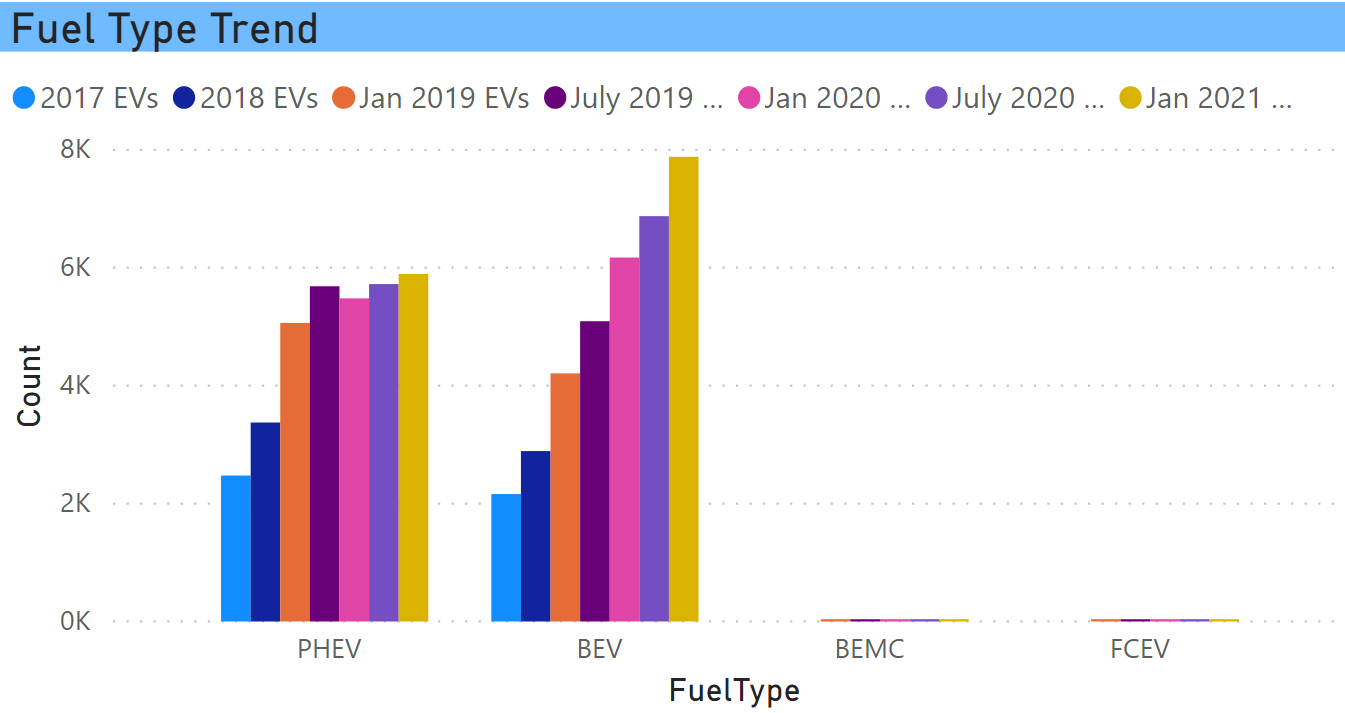
BEVs led the way with a 28% increase, followed by PHEVs up 7.5%. There are only 24 BEMCs and 3 FCEVs, the latter of which are not currently available to buy or lease in the state.
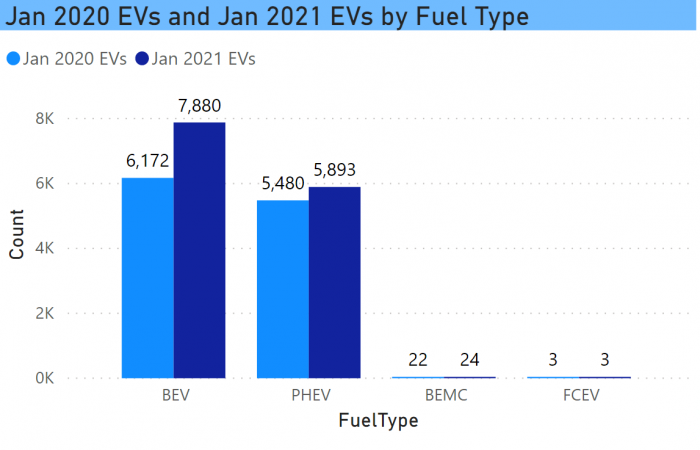
PHEV growth has flattened since 2019.
Tesla Again Leads By a Wide Margin
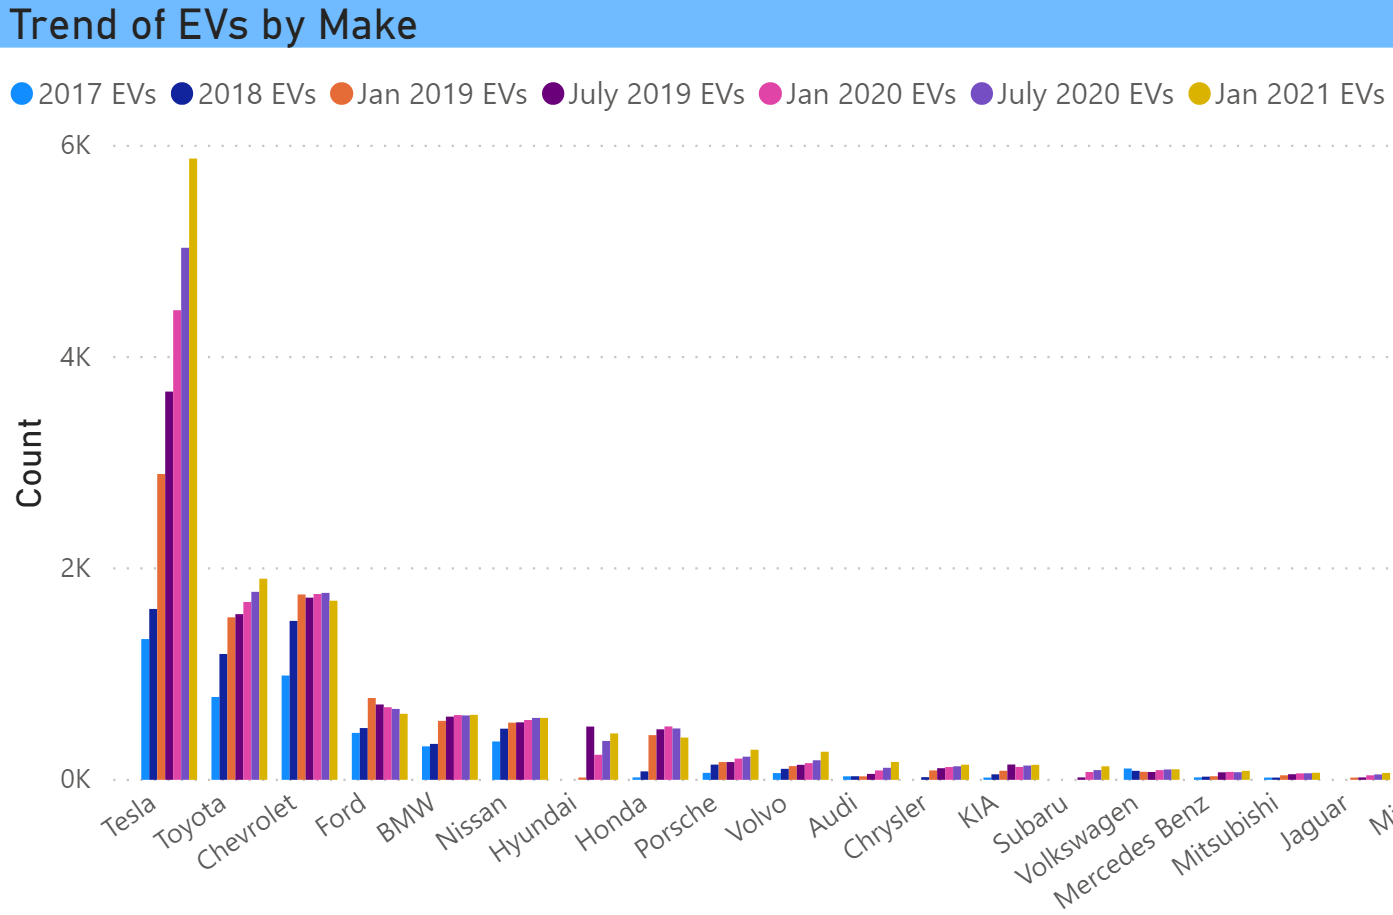
The chart below is an excerpt of the makes with the largest number of registered vehicles. Tesla continues robust growth (and they’re not allowed to open stores here, why???). Astonishingly, there is no other manufacturer with a strong increase. There are some that modestly increased (Toyota, Volvo, Audi, Subaru, Nissan), others that are basically flat (most), and a few major players that posted declines (Chevrolet, Ford, Honda). This is a decline in net registrations. It is a function of how many cars they sold versus the turnover in the existing base. Chevy is seeing older Volts exit the file. Honda has stopped trying to sell the Clarity in CT. There could be a change next year for Ford depending on deliveries of the Mustang Mach-E.
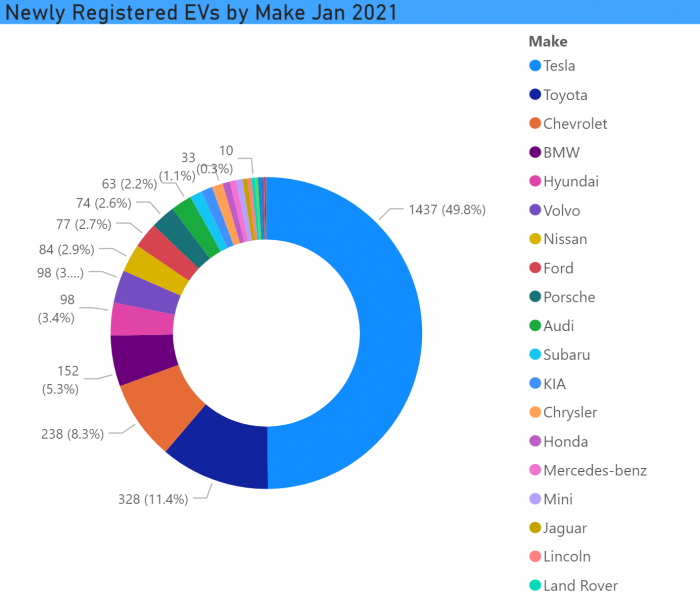
Tesla was responsible for 47% of the vehicles entering the file.
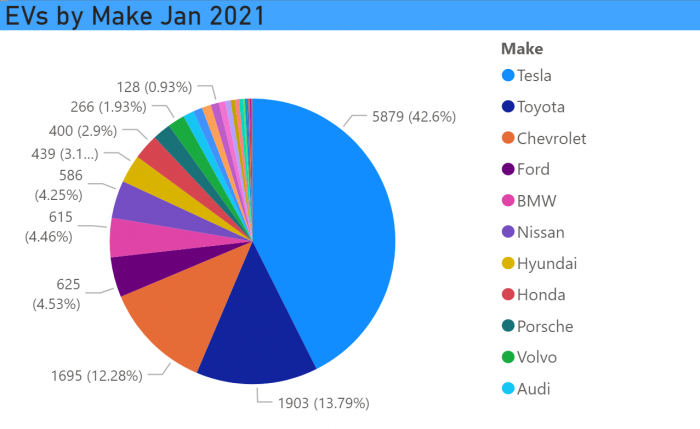
This brought its net share to 43%, up from 40% in July.
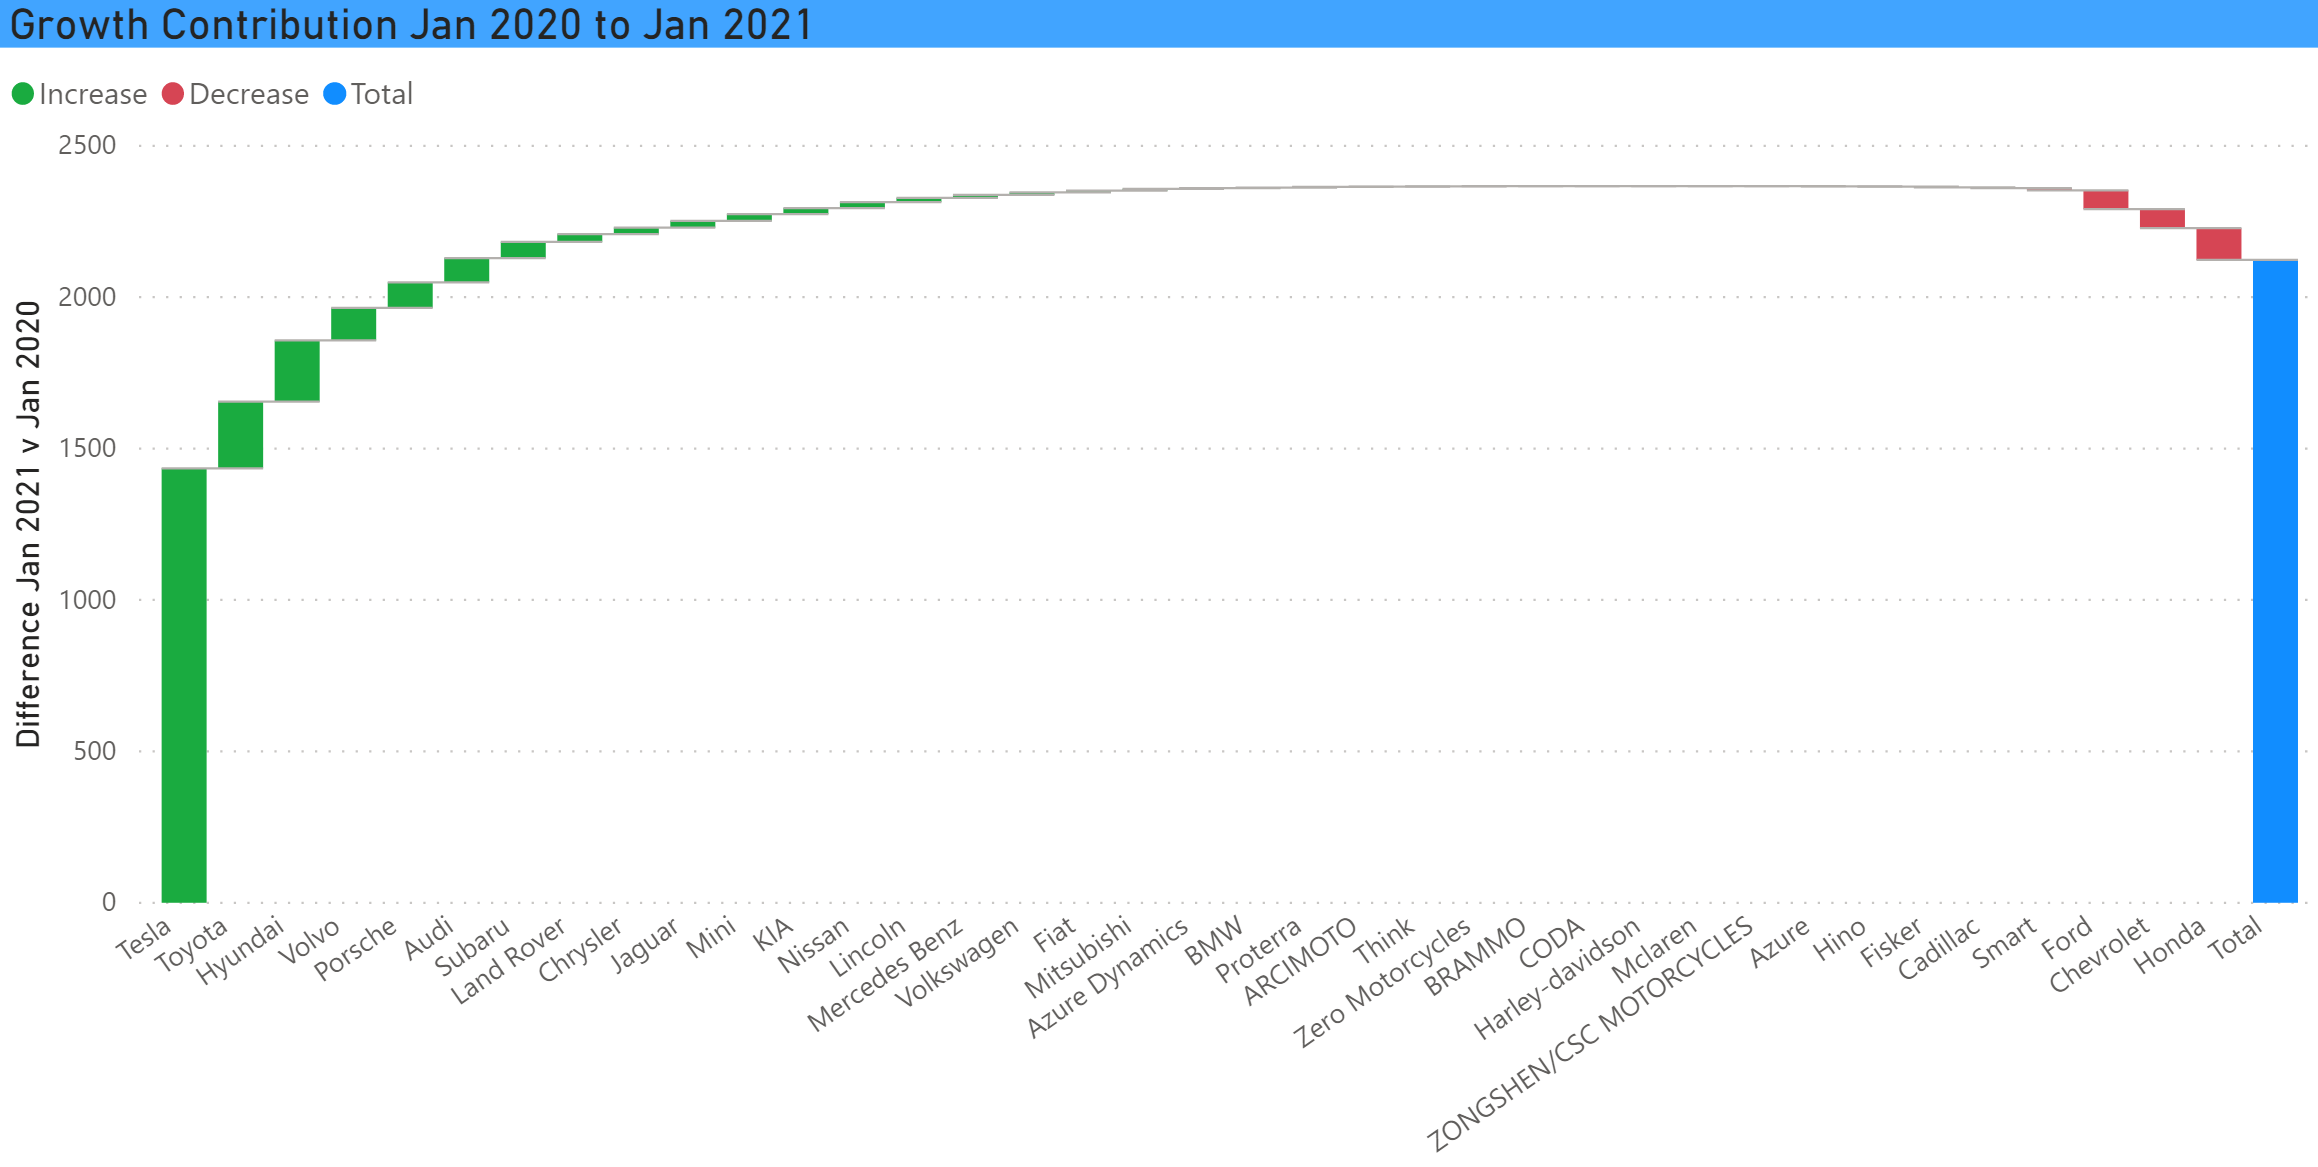
This trend is most dramatically illustrated in this growth contribution waterfall chart, which takes the YOY difference in registrations by make and divides it by total net new registrations. This reflects both positive and negative contributions.
Watch this space. More to come…..