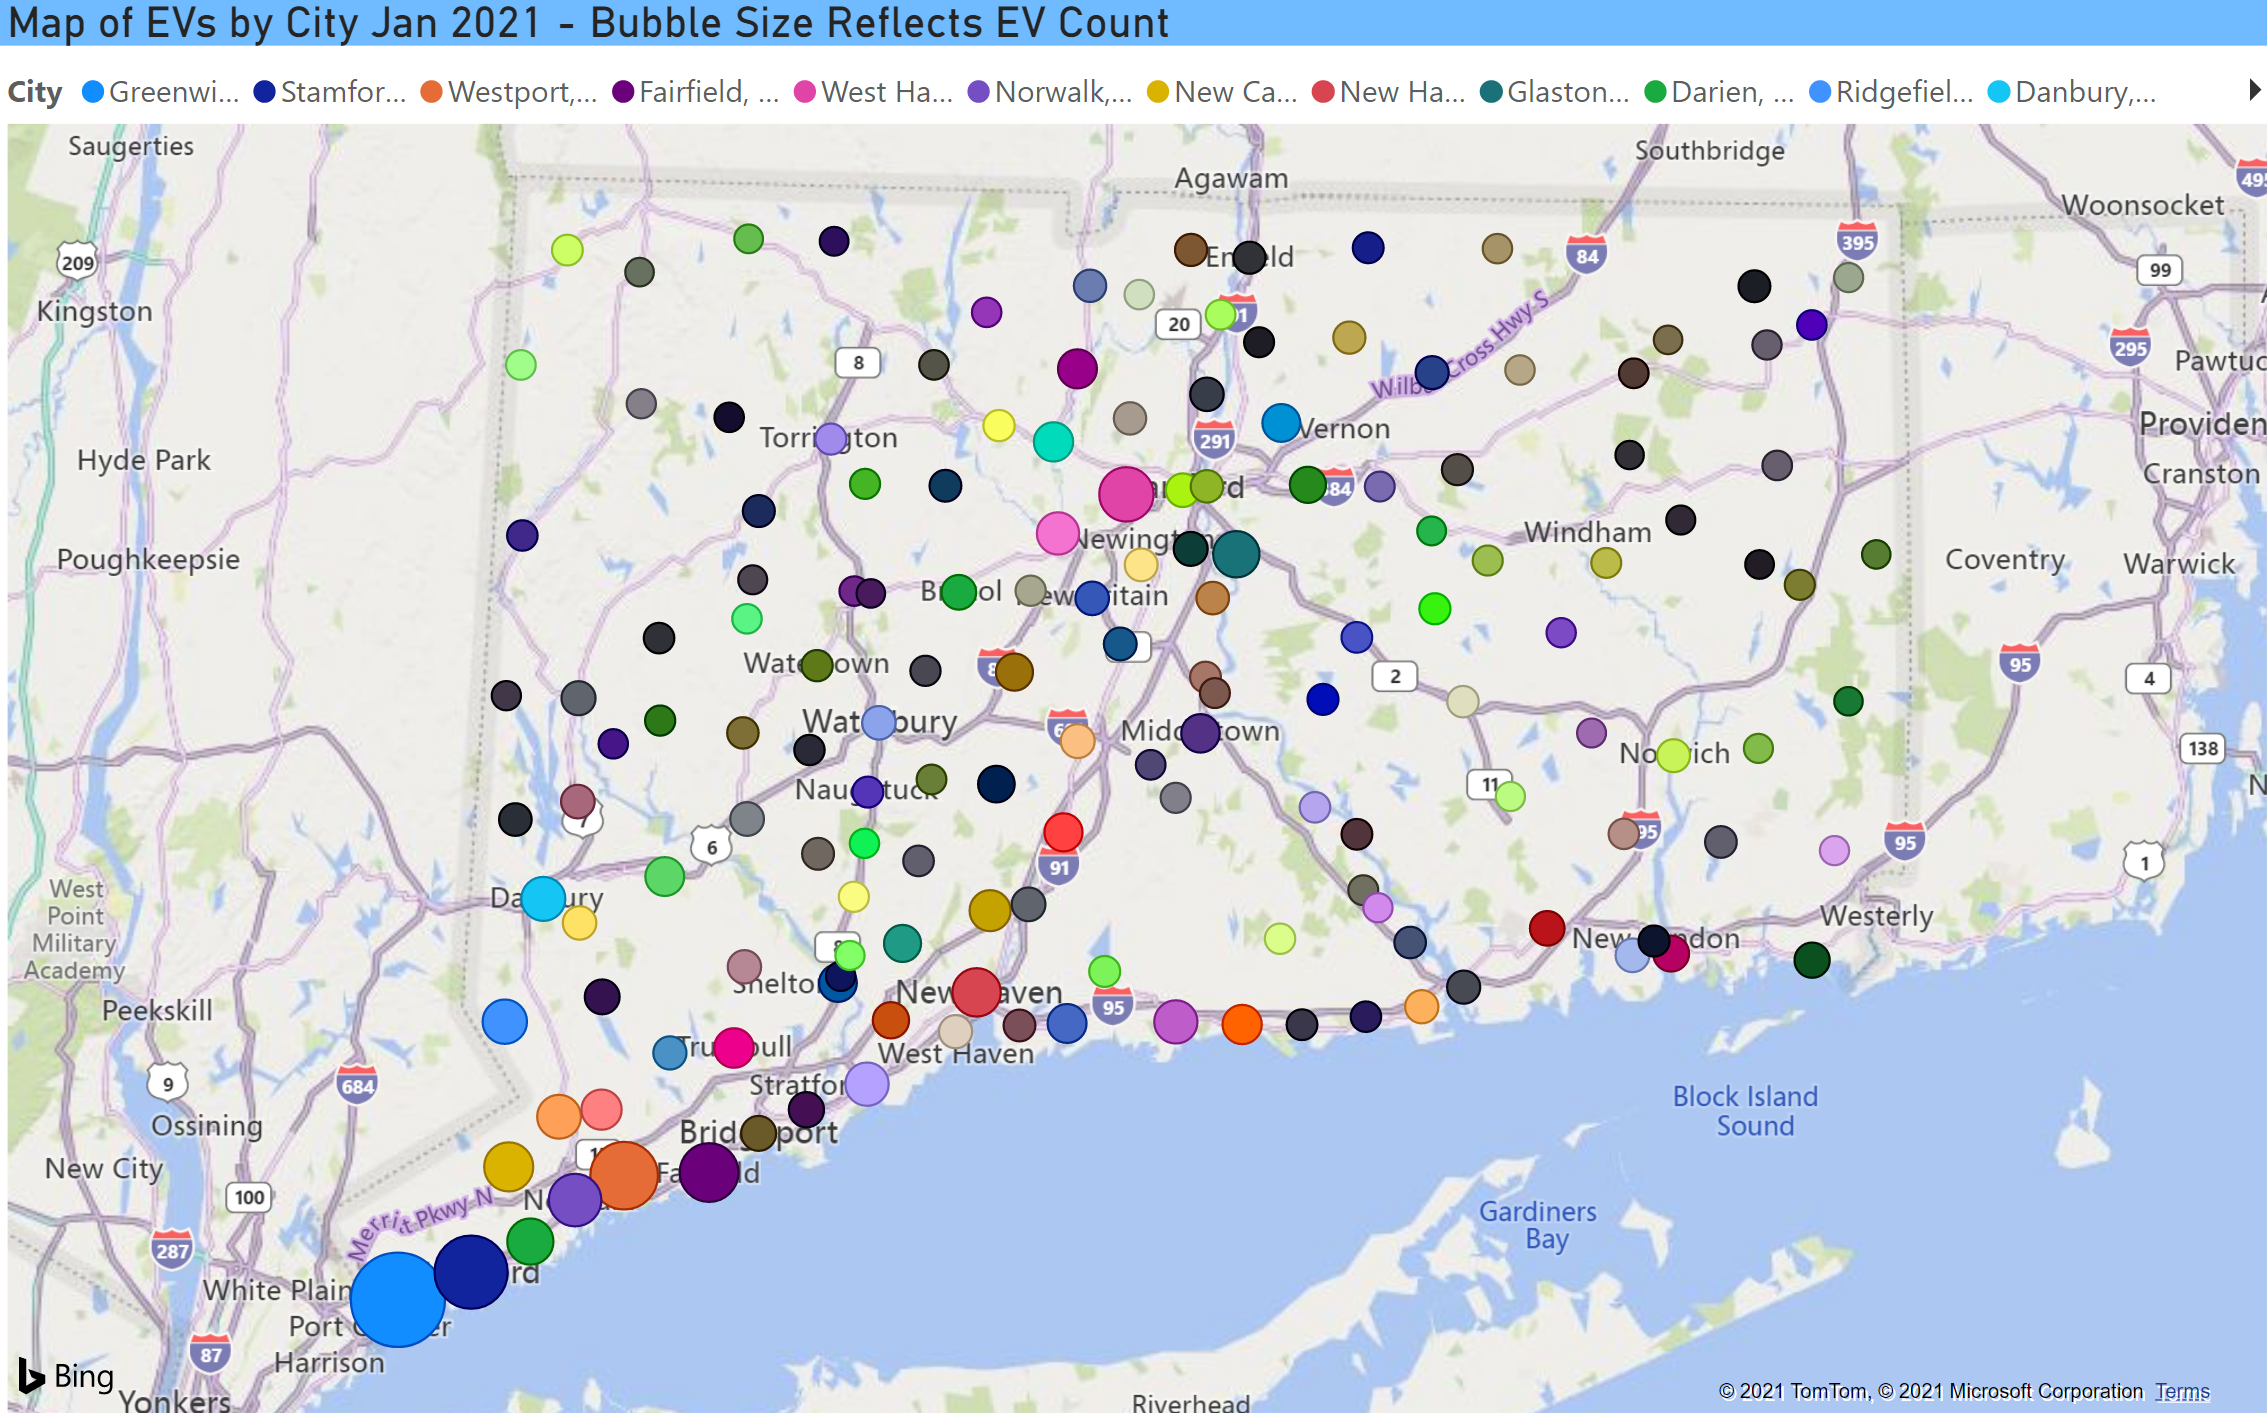


The map in the top image shows the number of EVs by city reflected by the size of the circle.
Most EVs Located in Fairfield County
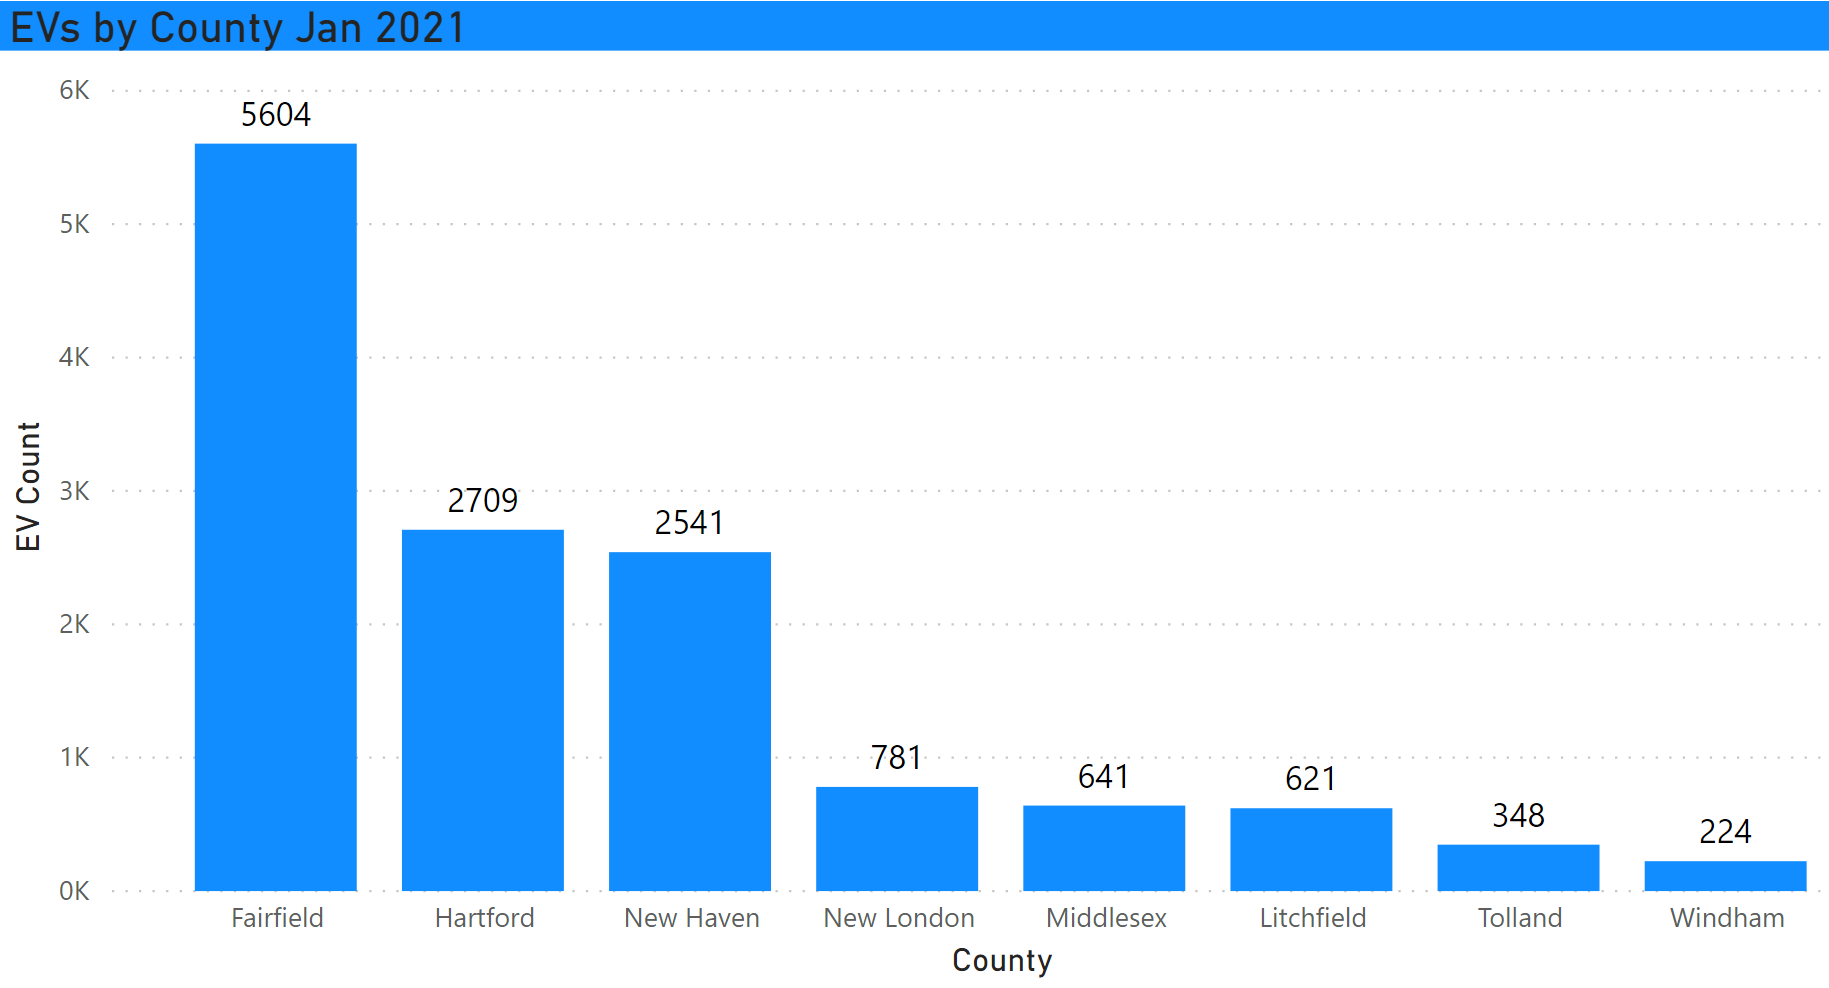
The largest concentration of EVs remains in the southwestern part of the state, specifically Fairfield County with 41% of all EVs in the state. This is similar to past waves of data.
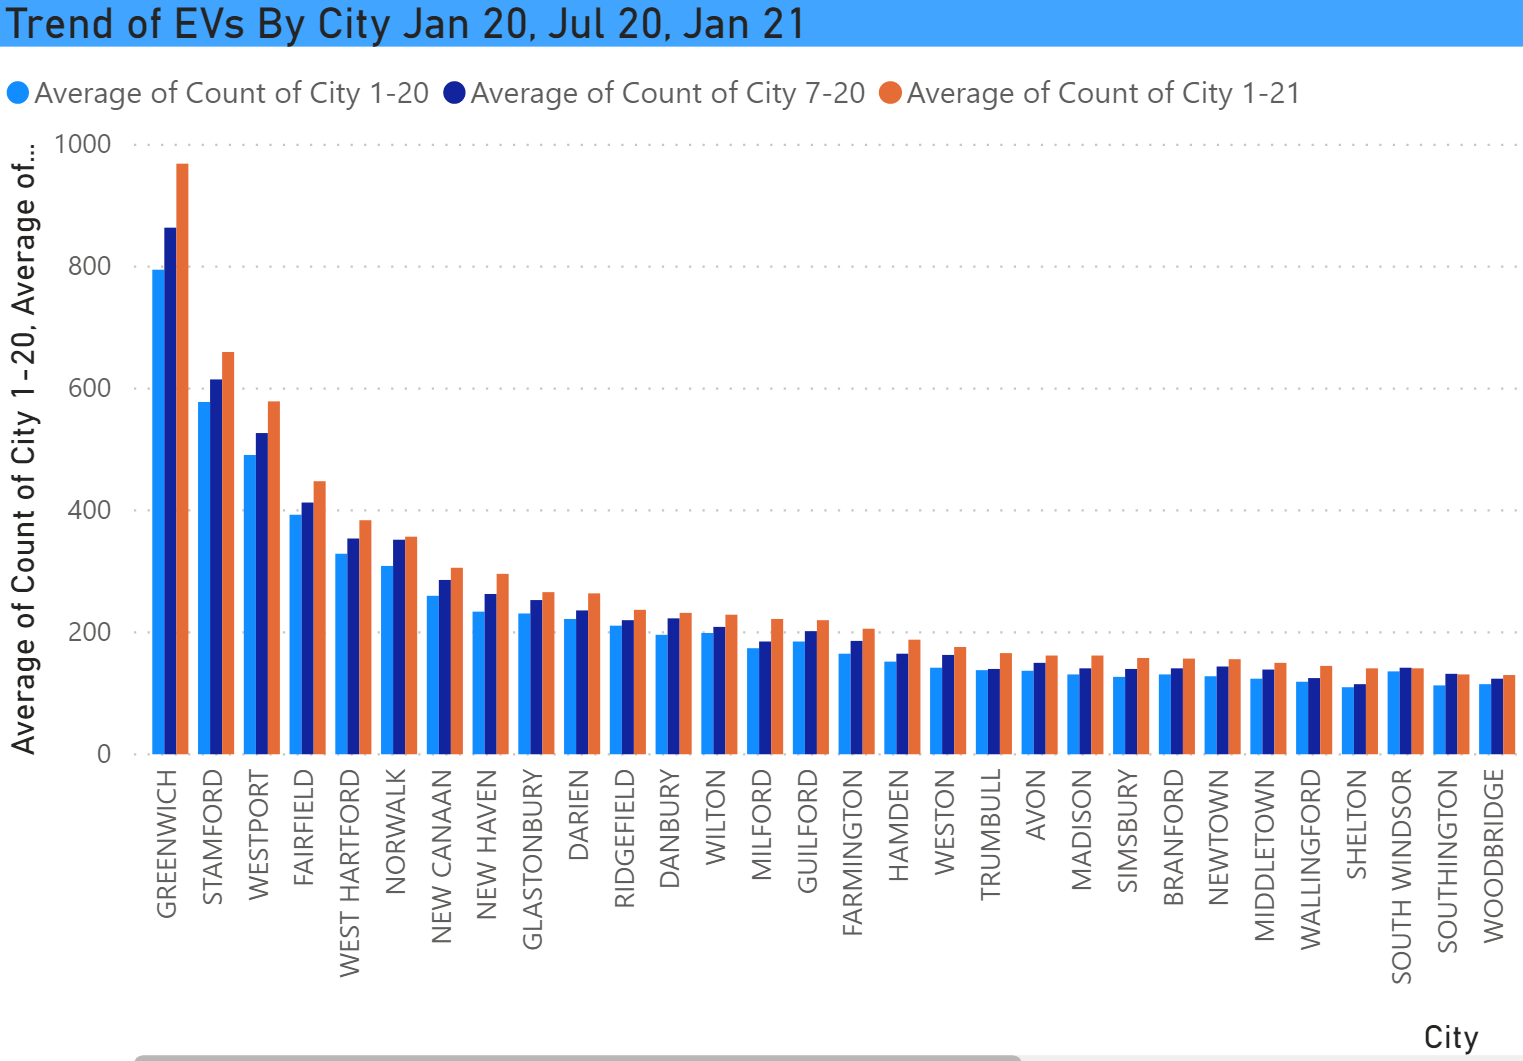
The top cities in terms of raw numbers of EVs remain Greenwich, Stamford, and Westport with 969, 660, 579 respectively.
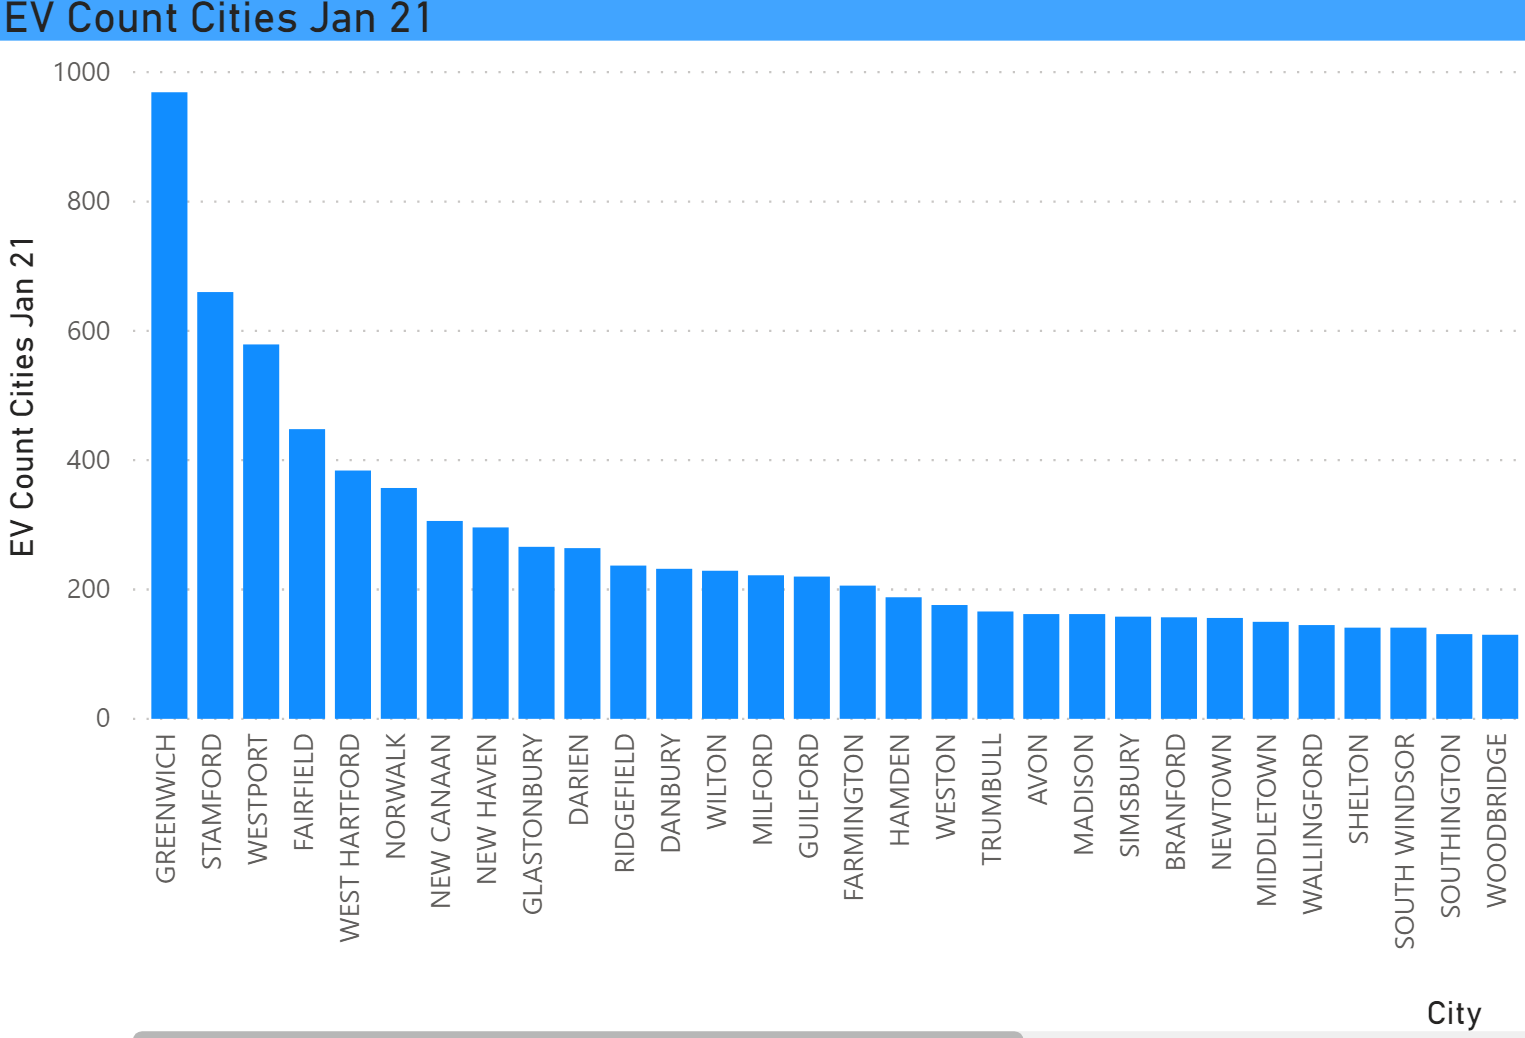
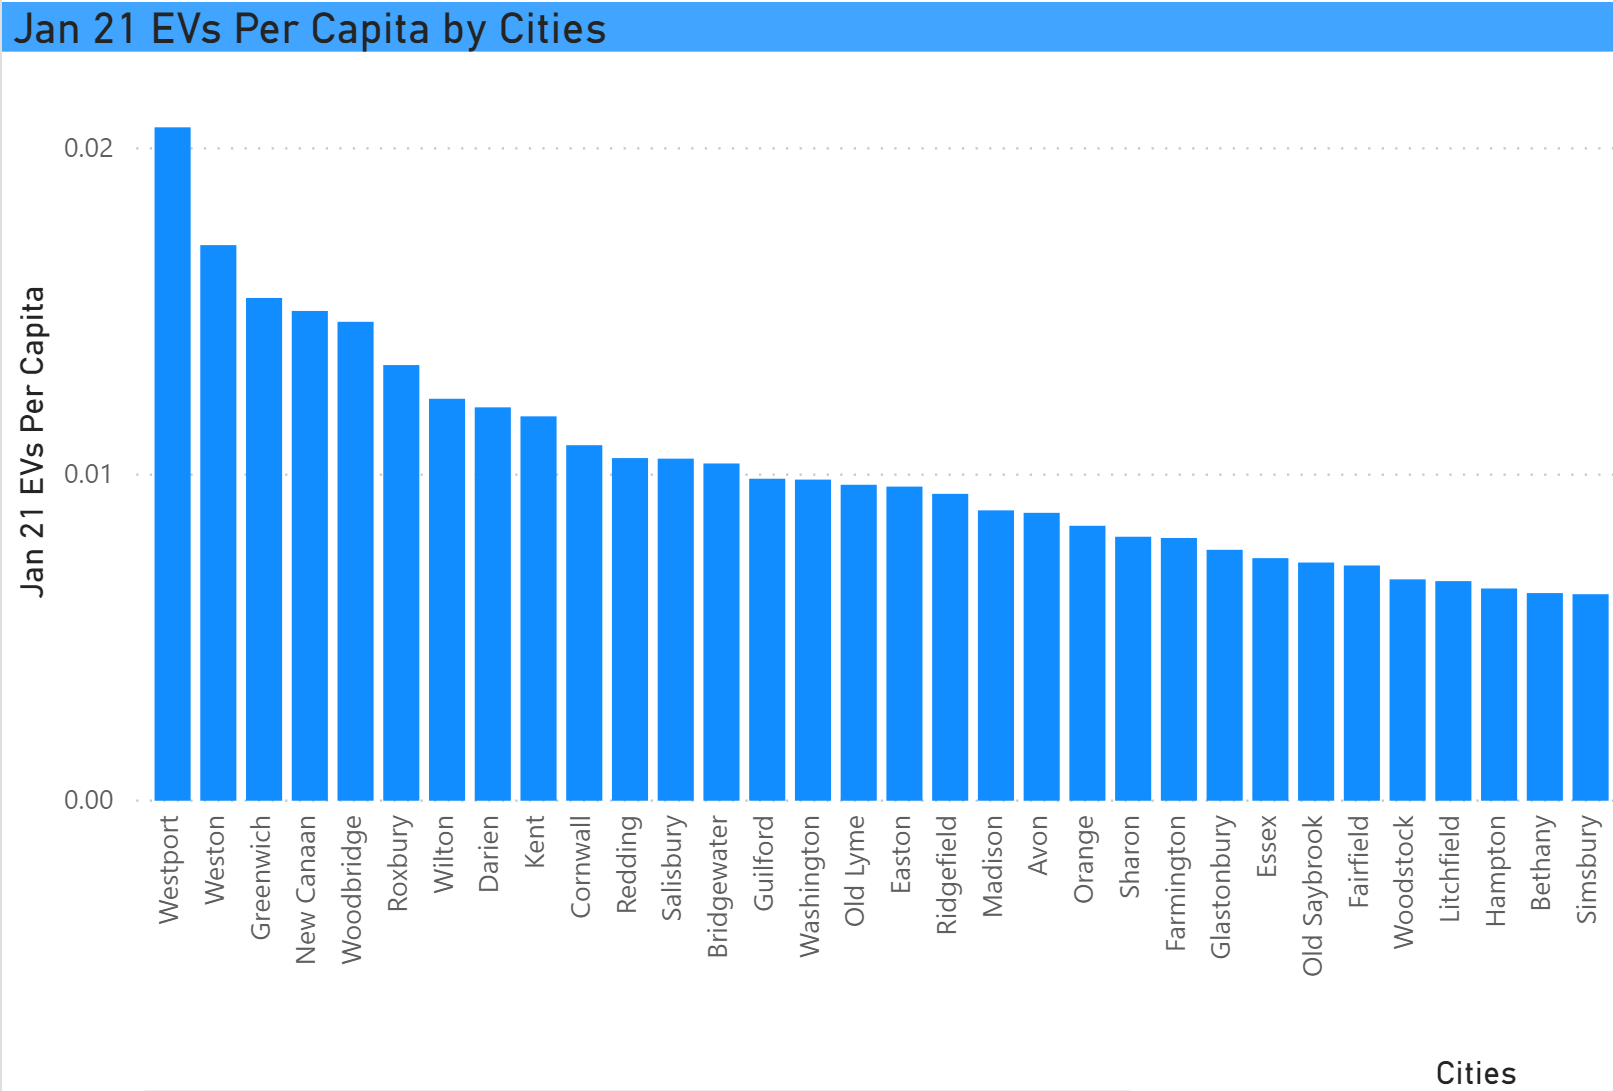
Westport remains number one per capita, followed by Weston and Greenwich.
This is the trend by city of the past 18 months. The largest increase in this wave was seen in Greenwich.
Thank you for sharing this information! This motivates me so much, the more EVs the better!
Will there be a breakdown of types of EVs? Are you accounting for Hybrids as well?
Emily, conventional hybrids are not part of this dataset. Plug-in hybrids are. We are following the definitions of the Zero-Emission Vehicles Memorandum of Understanding. By breakdown of EVs, if you mean fuel-type – BEV, PHEV, FCEV, that is in the dashboard and covered by an earlier blog post: https://bit.ly/Dash21-1
If you have more questions, feel free to ping me offline.