Where The EVs are – Jan 2022 Edition
Barry Kresch
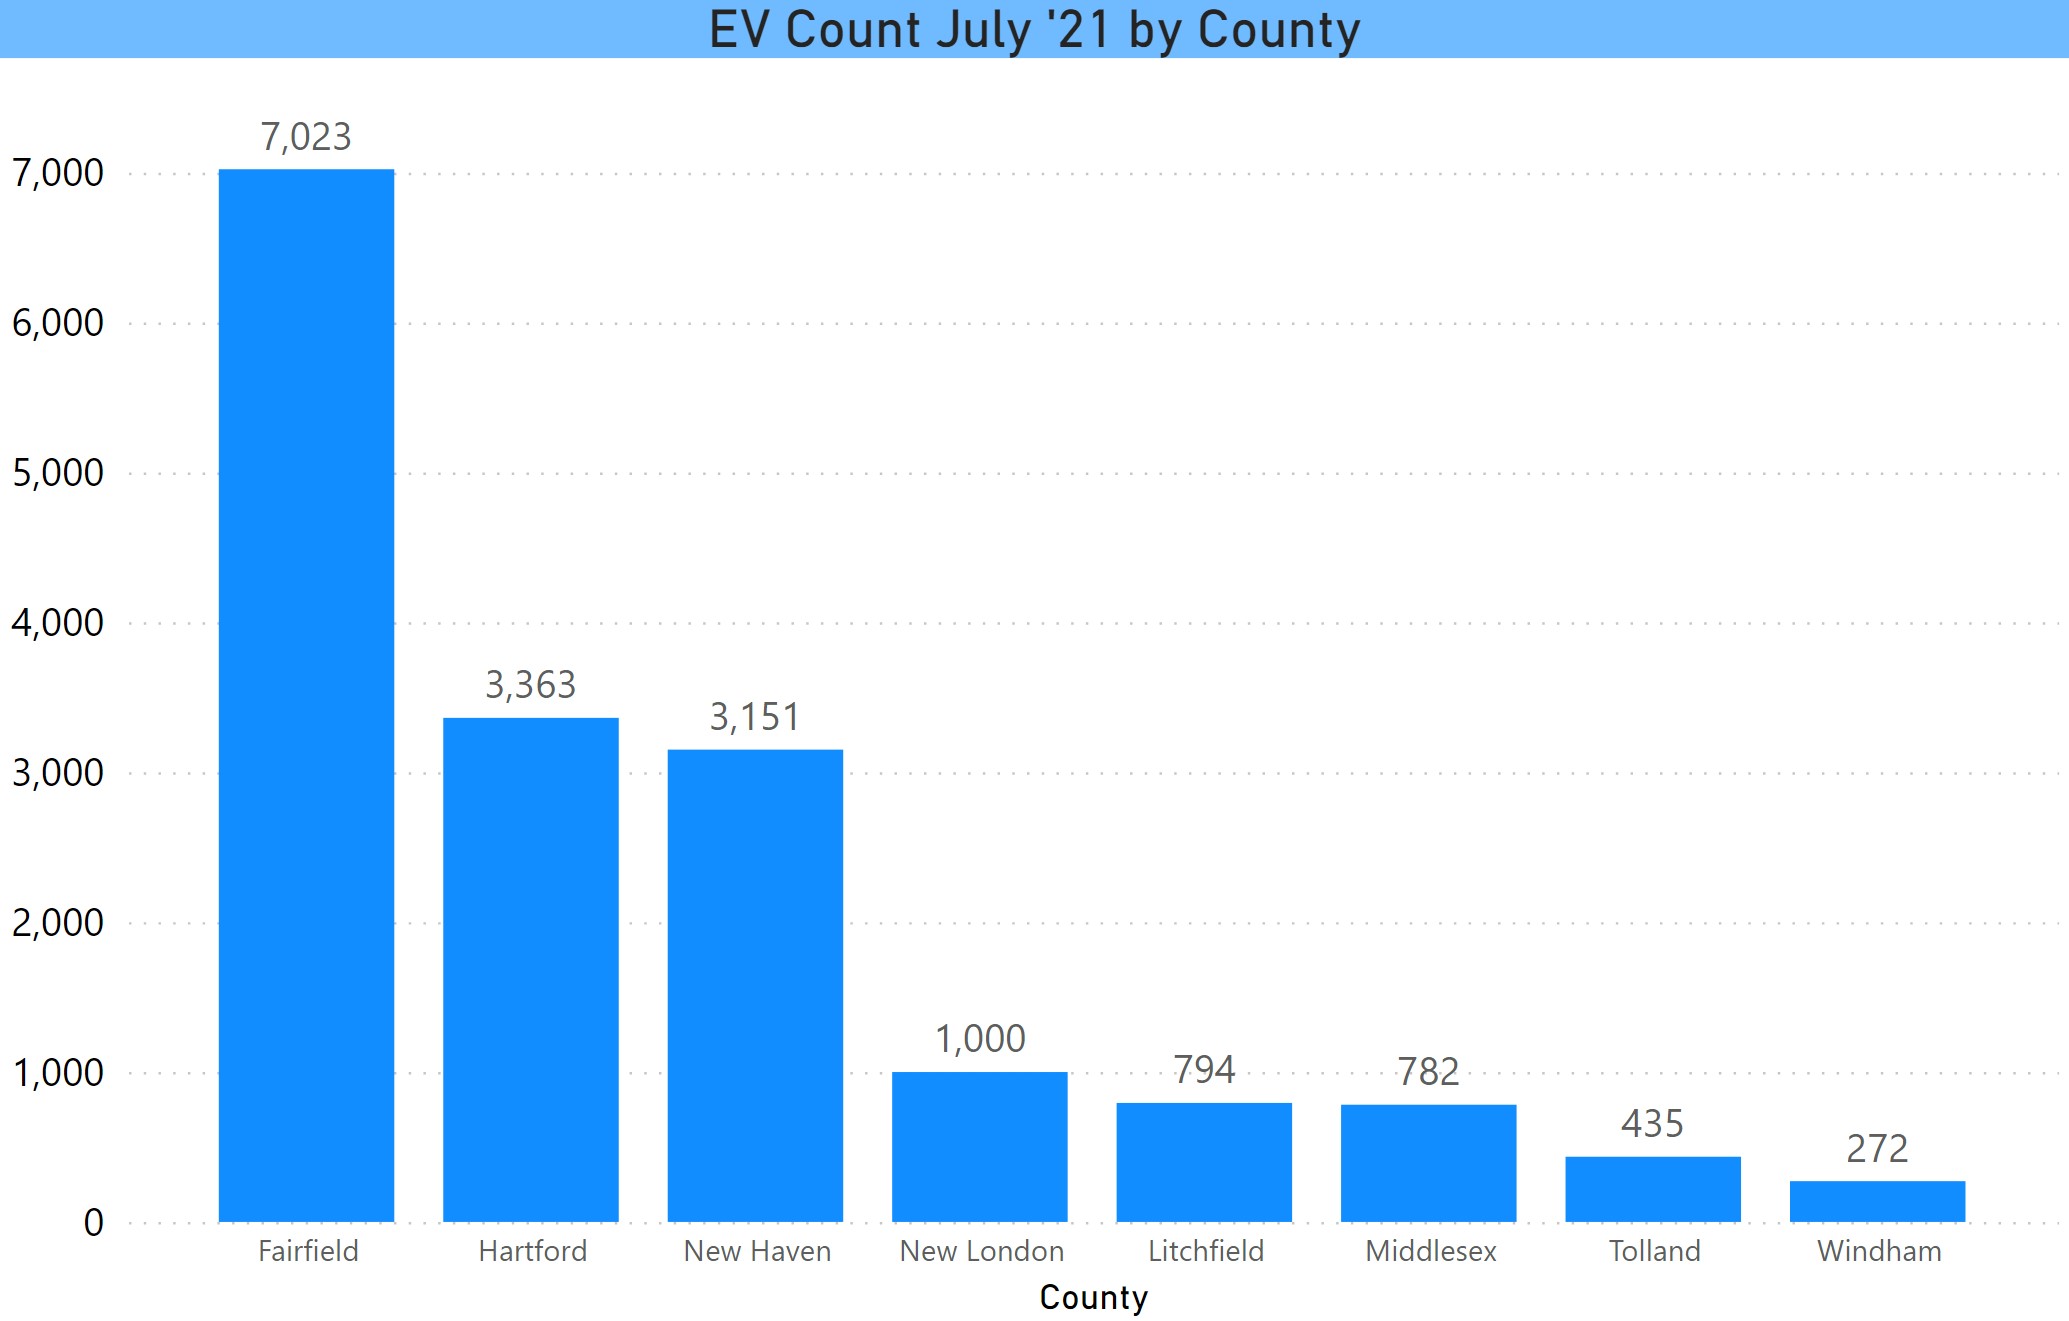
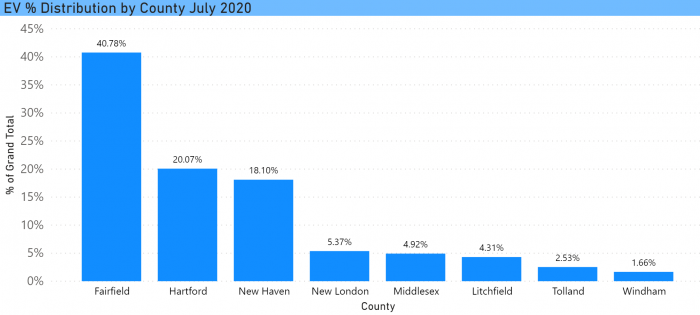
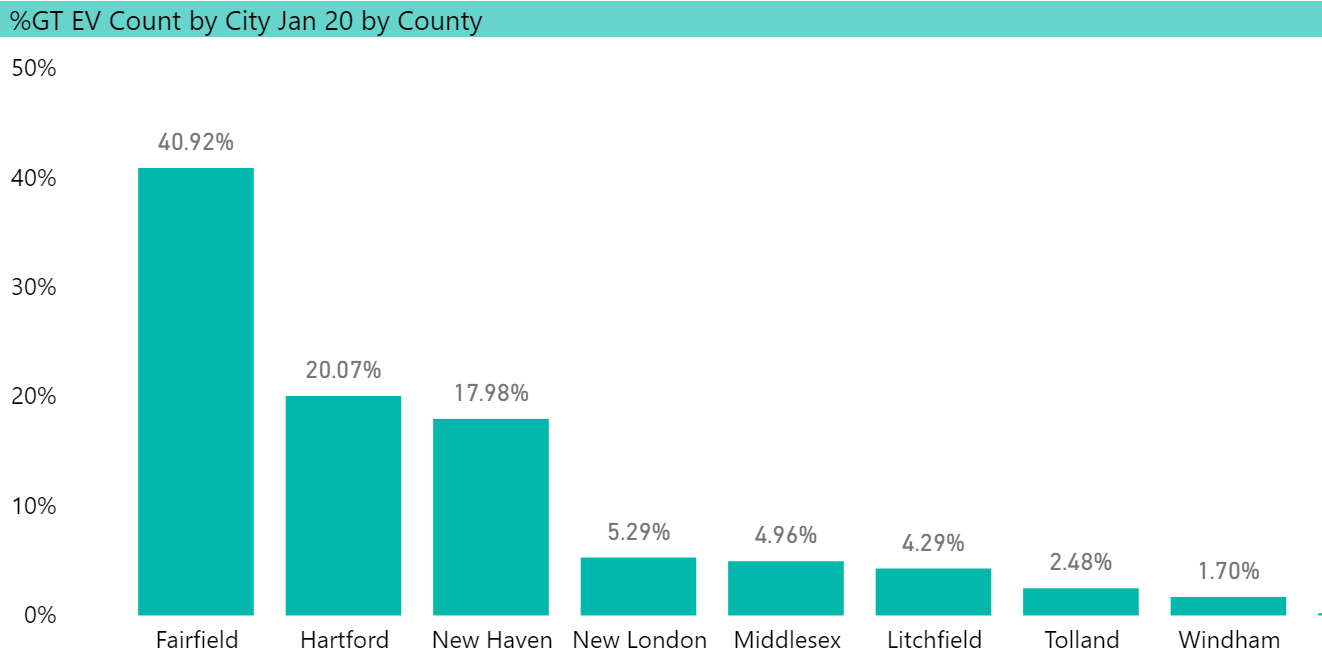
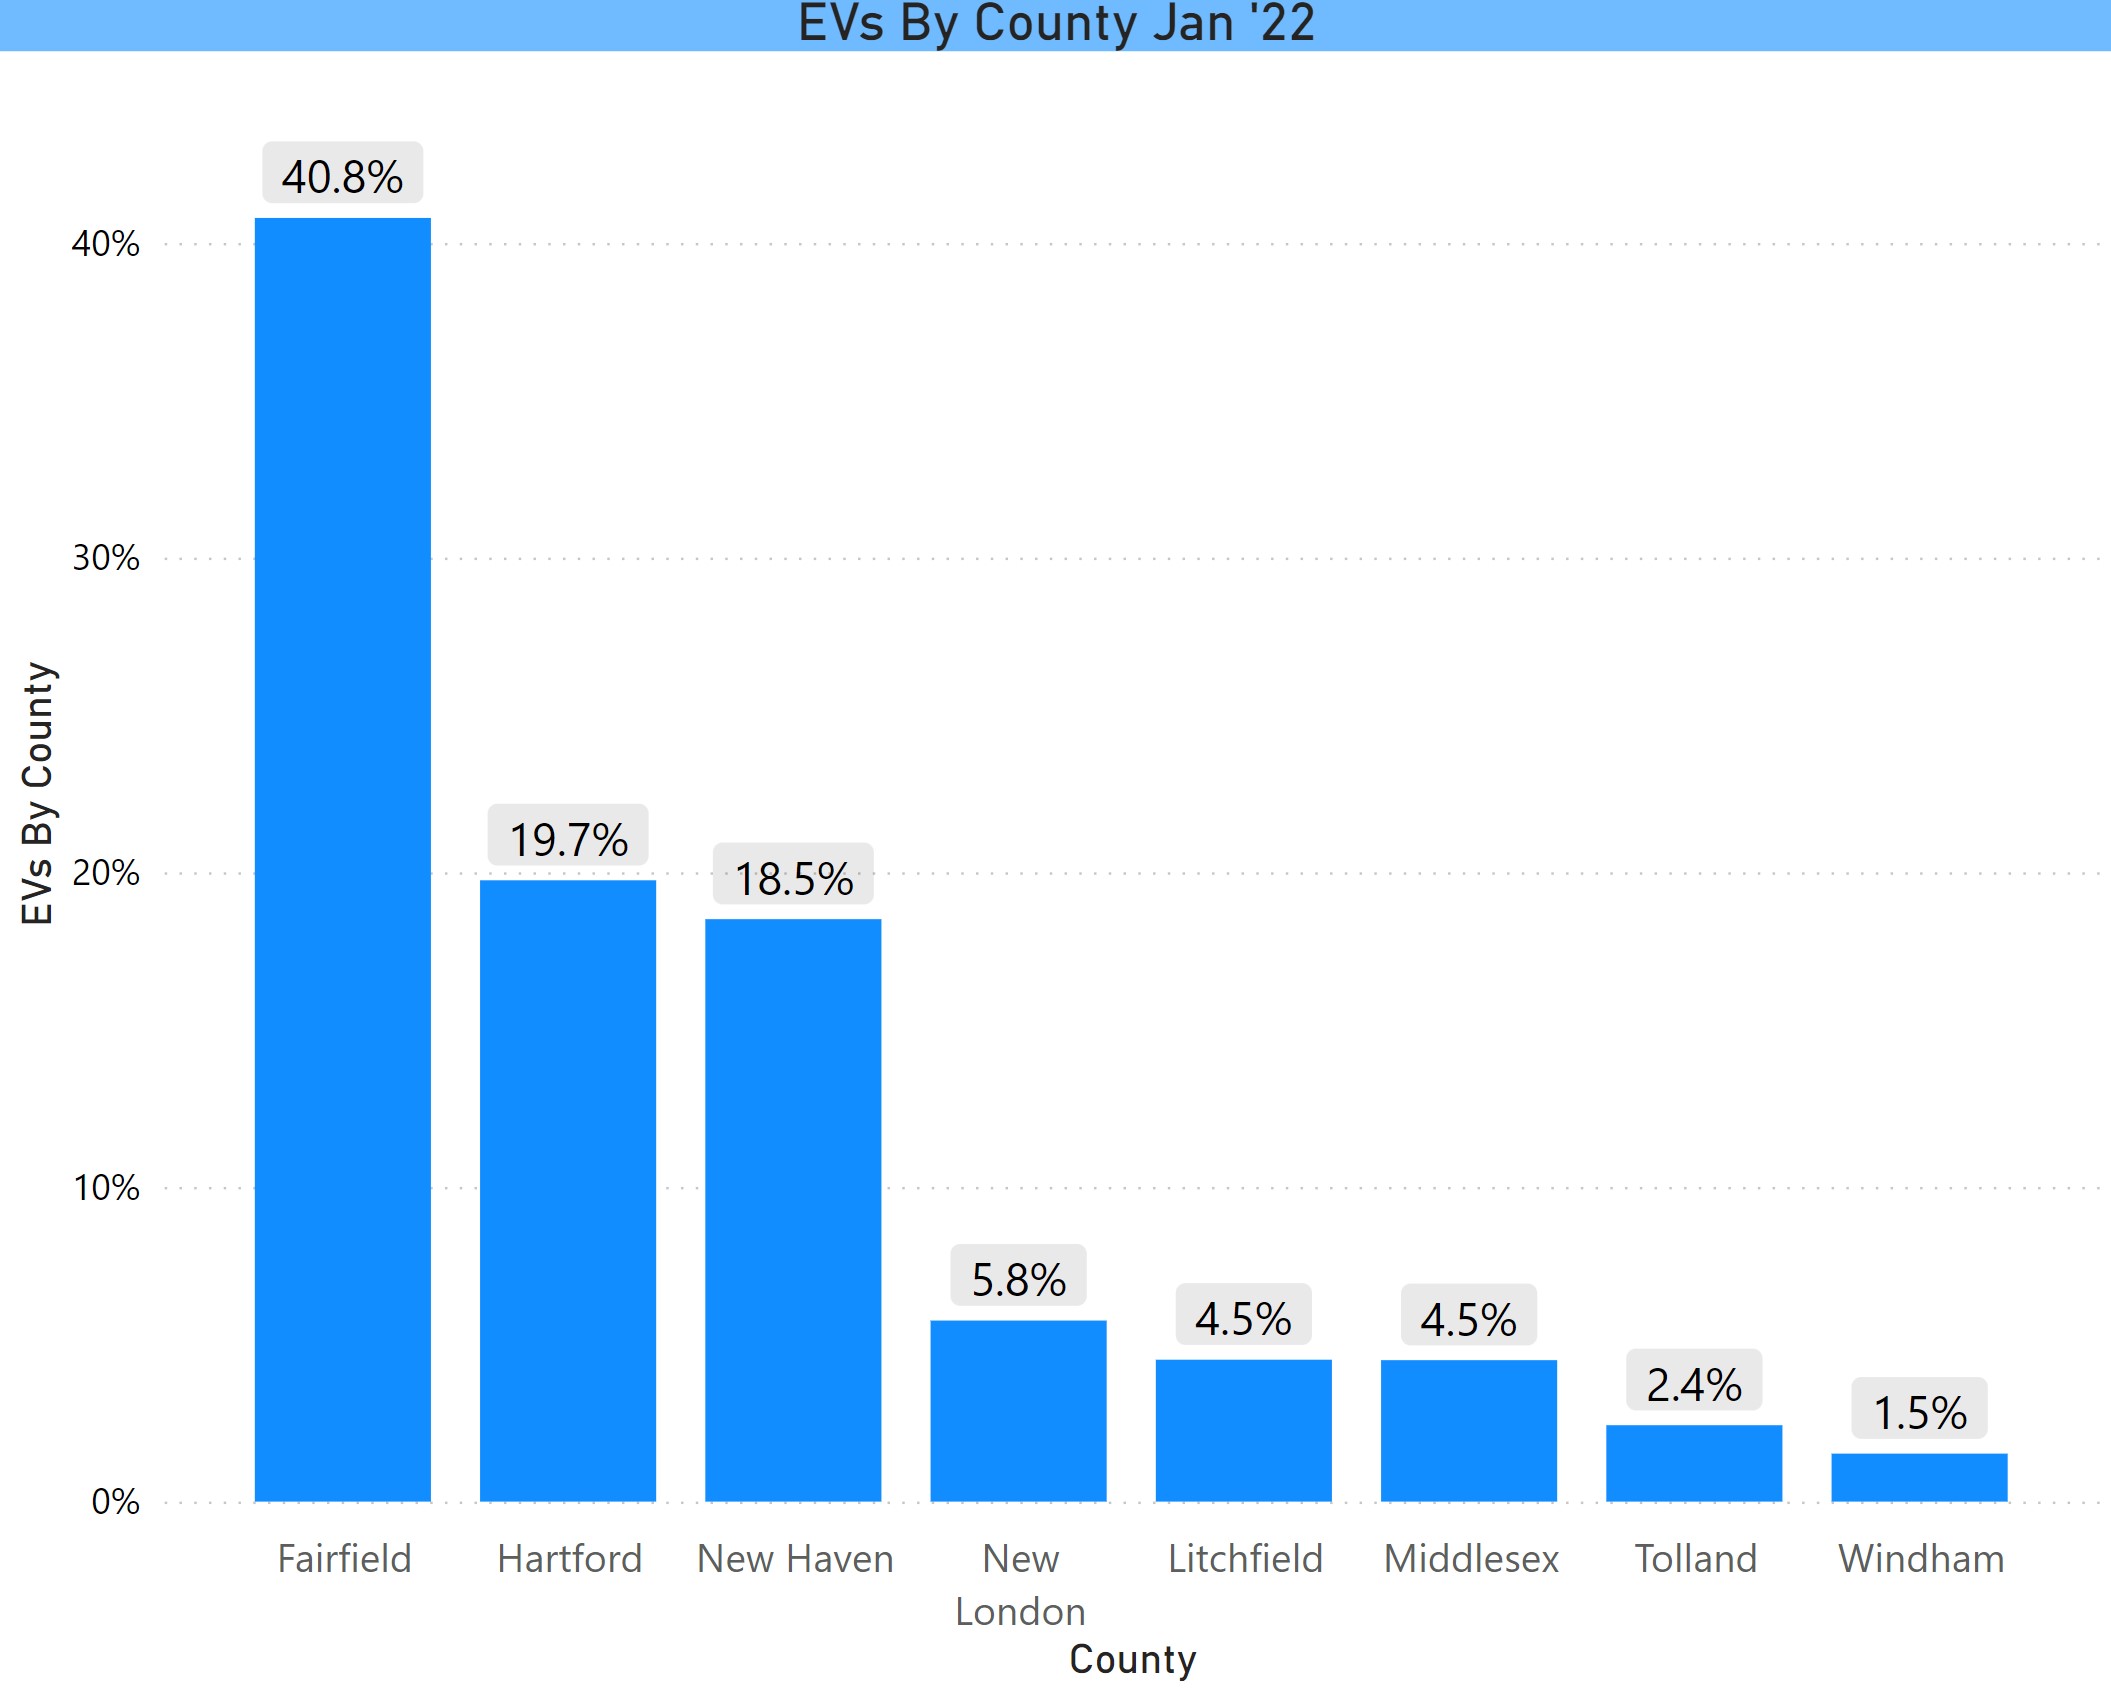
41% of CT EVs in Fairfield County
Hartford and New Haven Counties make up the bulk of the rest. When filtered for BEVs, there is even more of a Fairfield County skew.
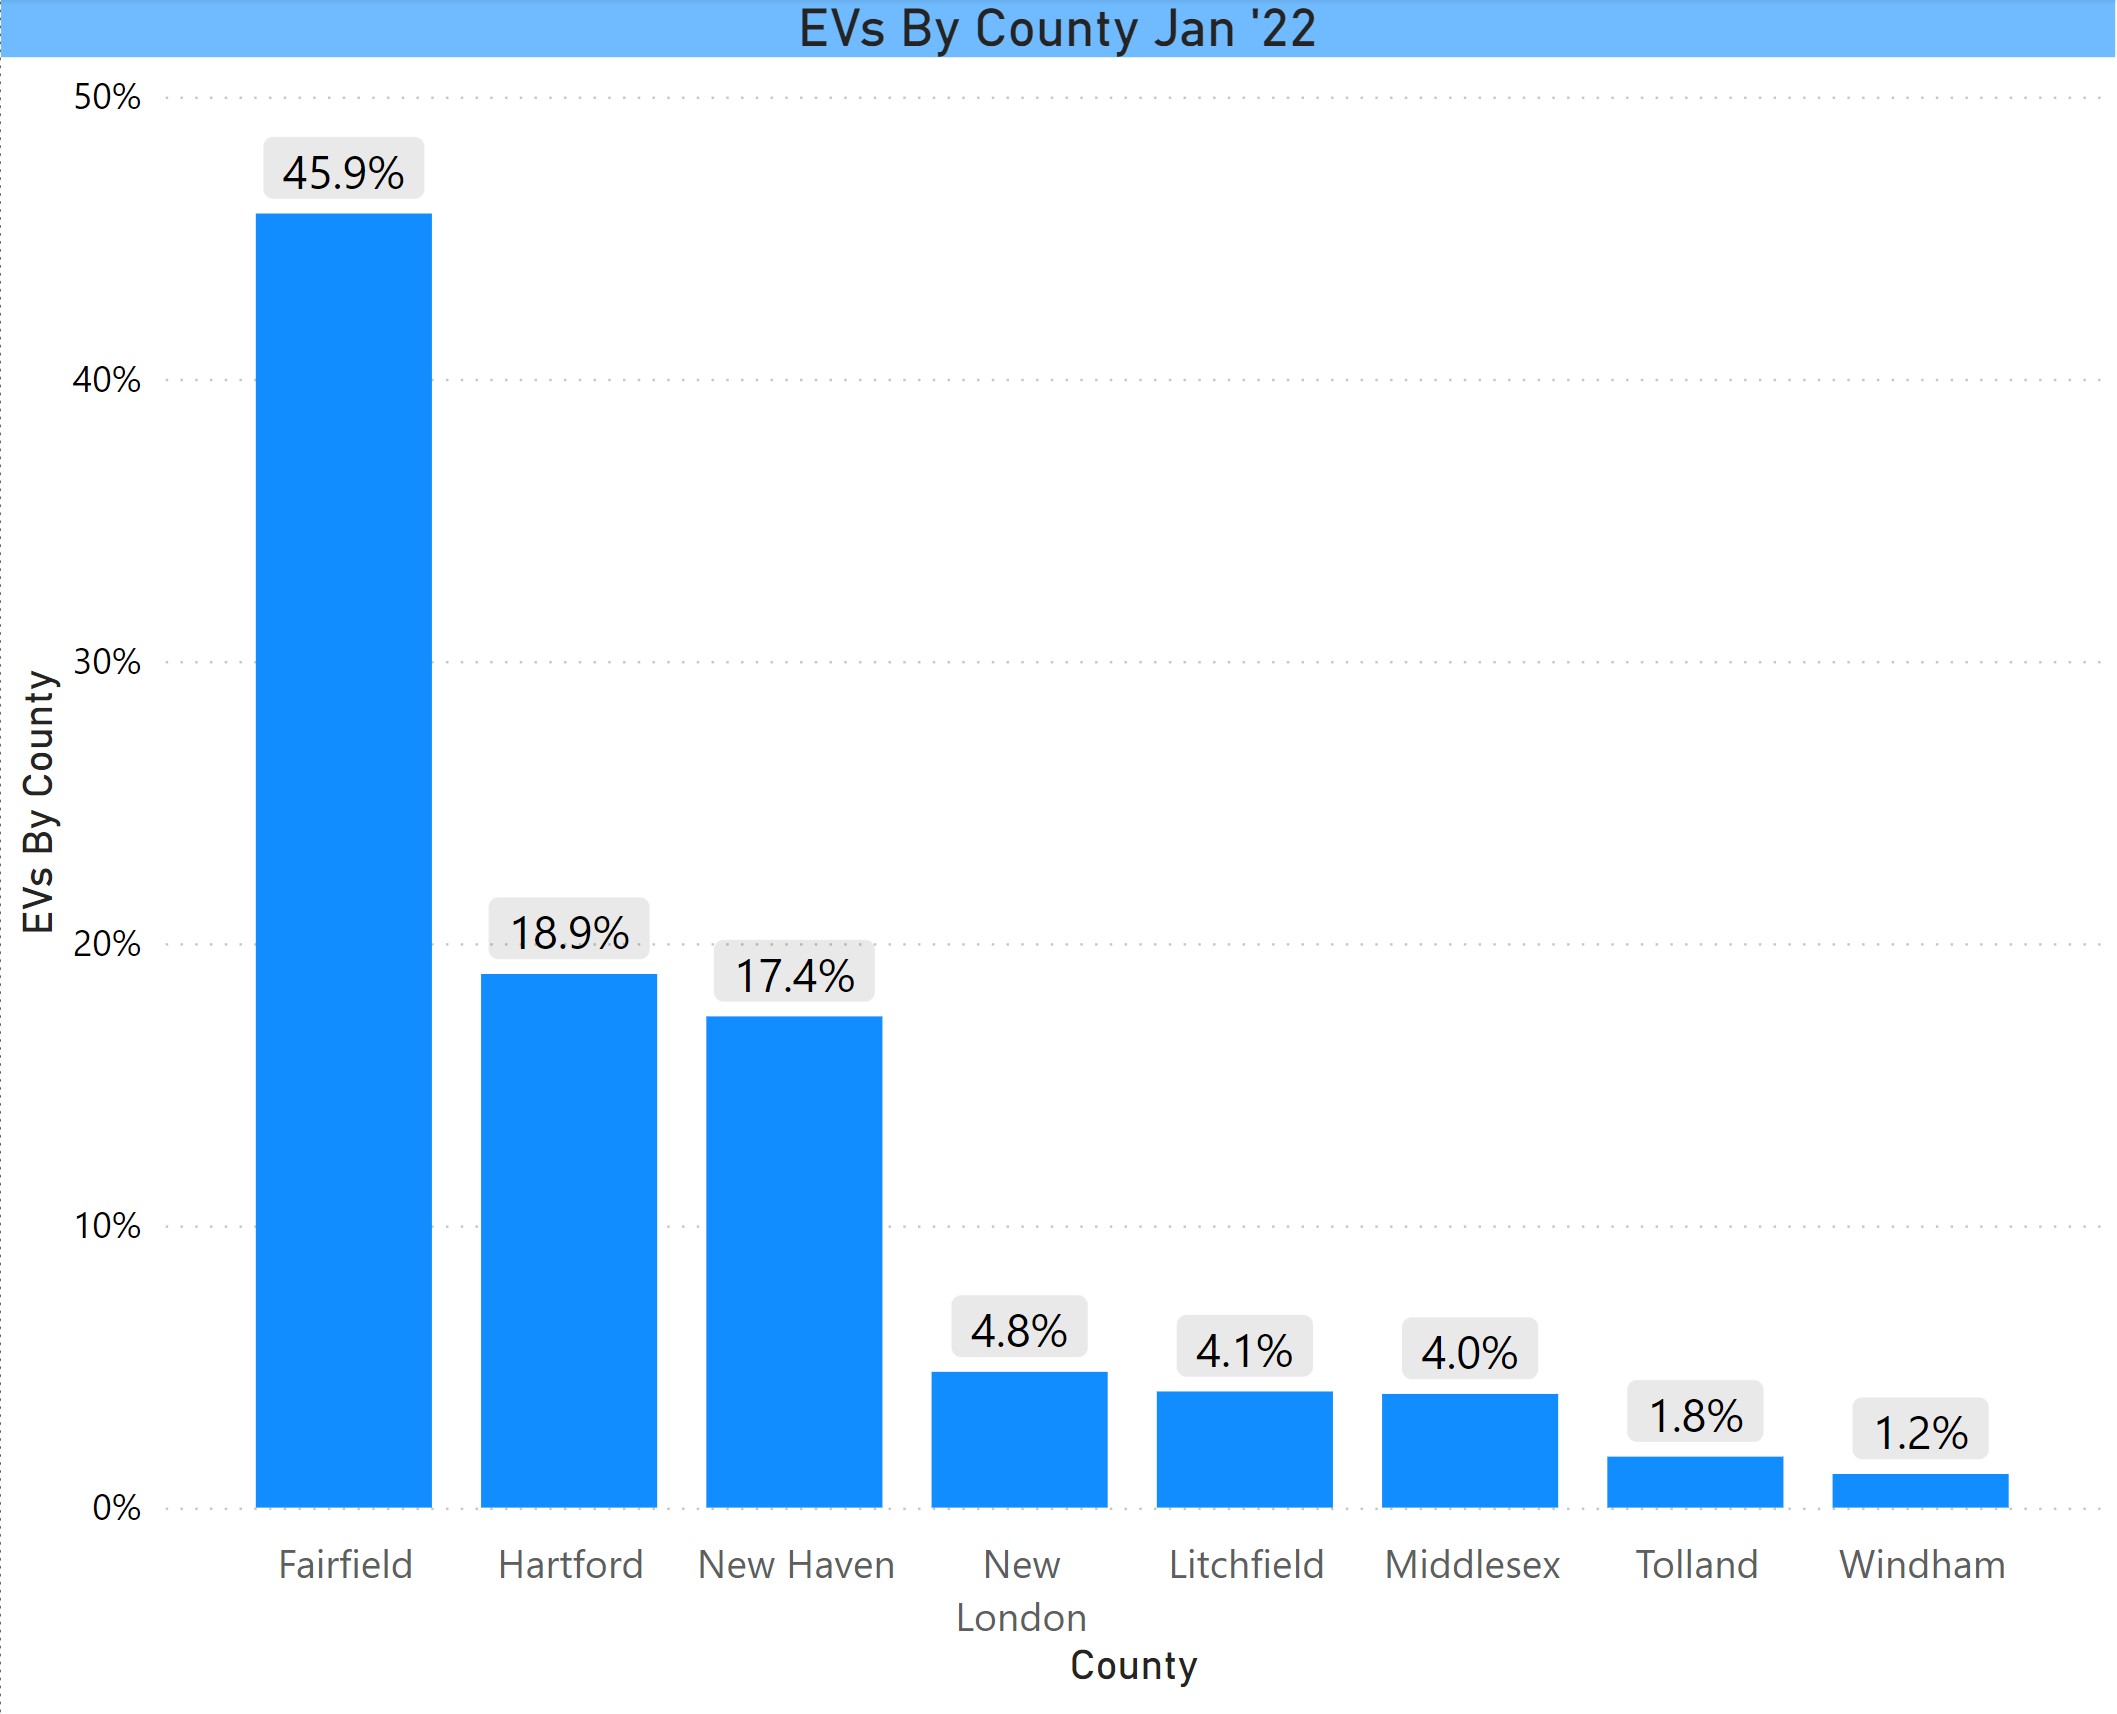
% BEV by County
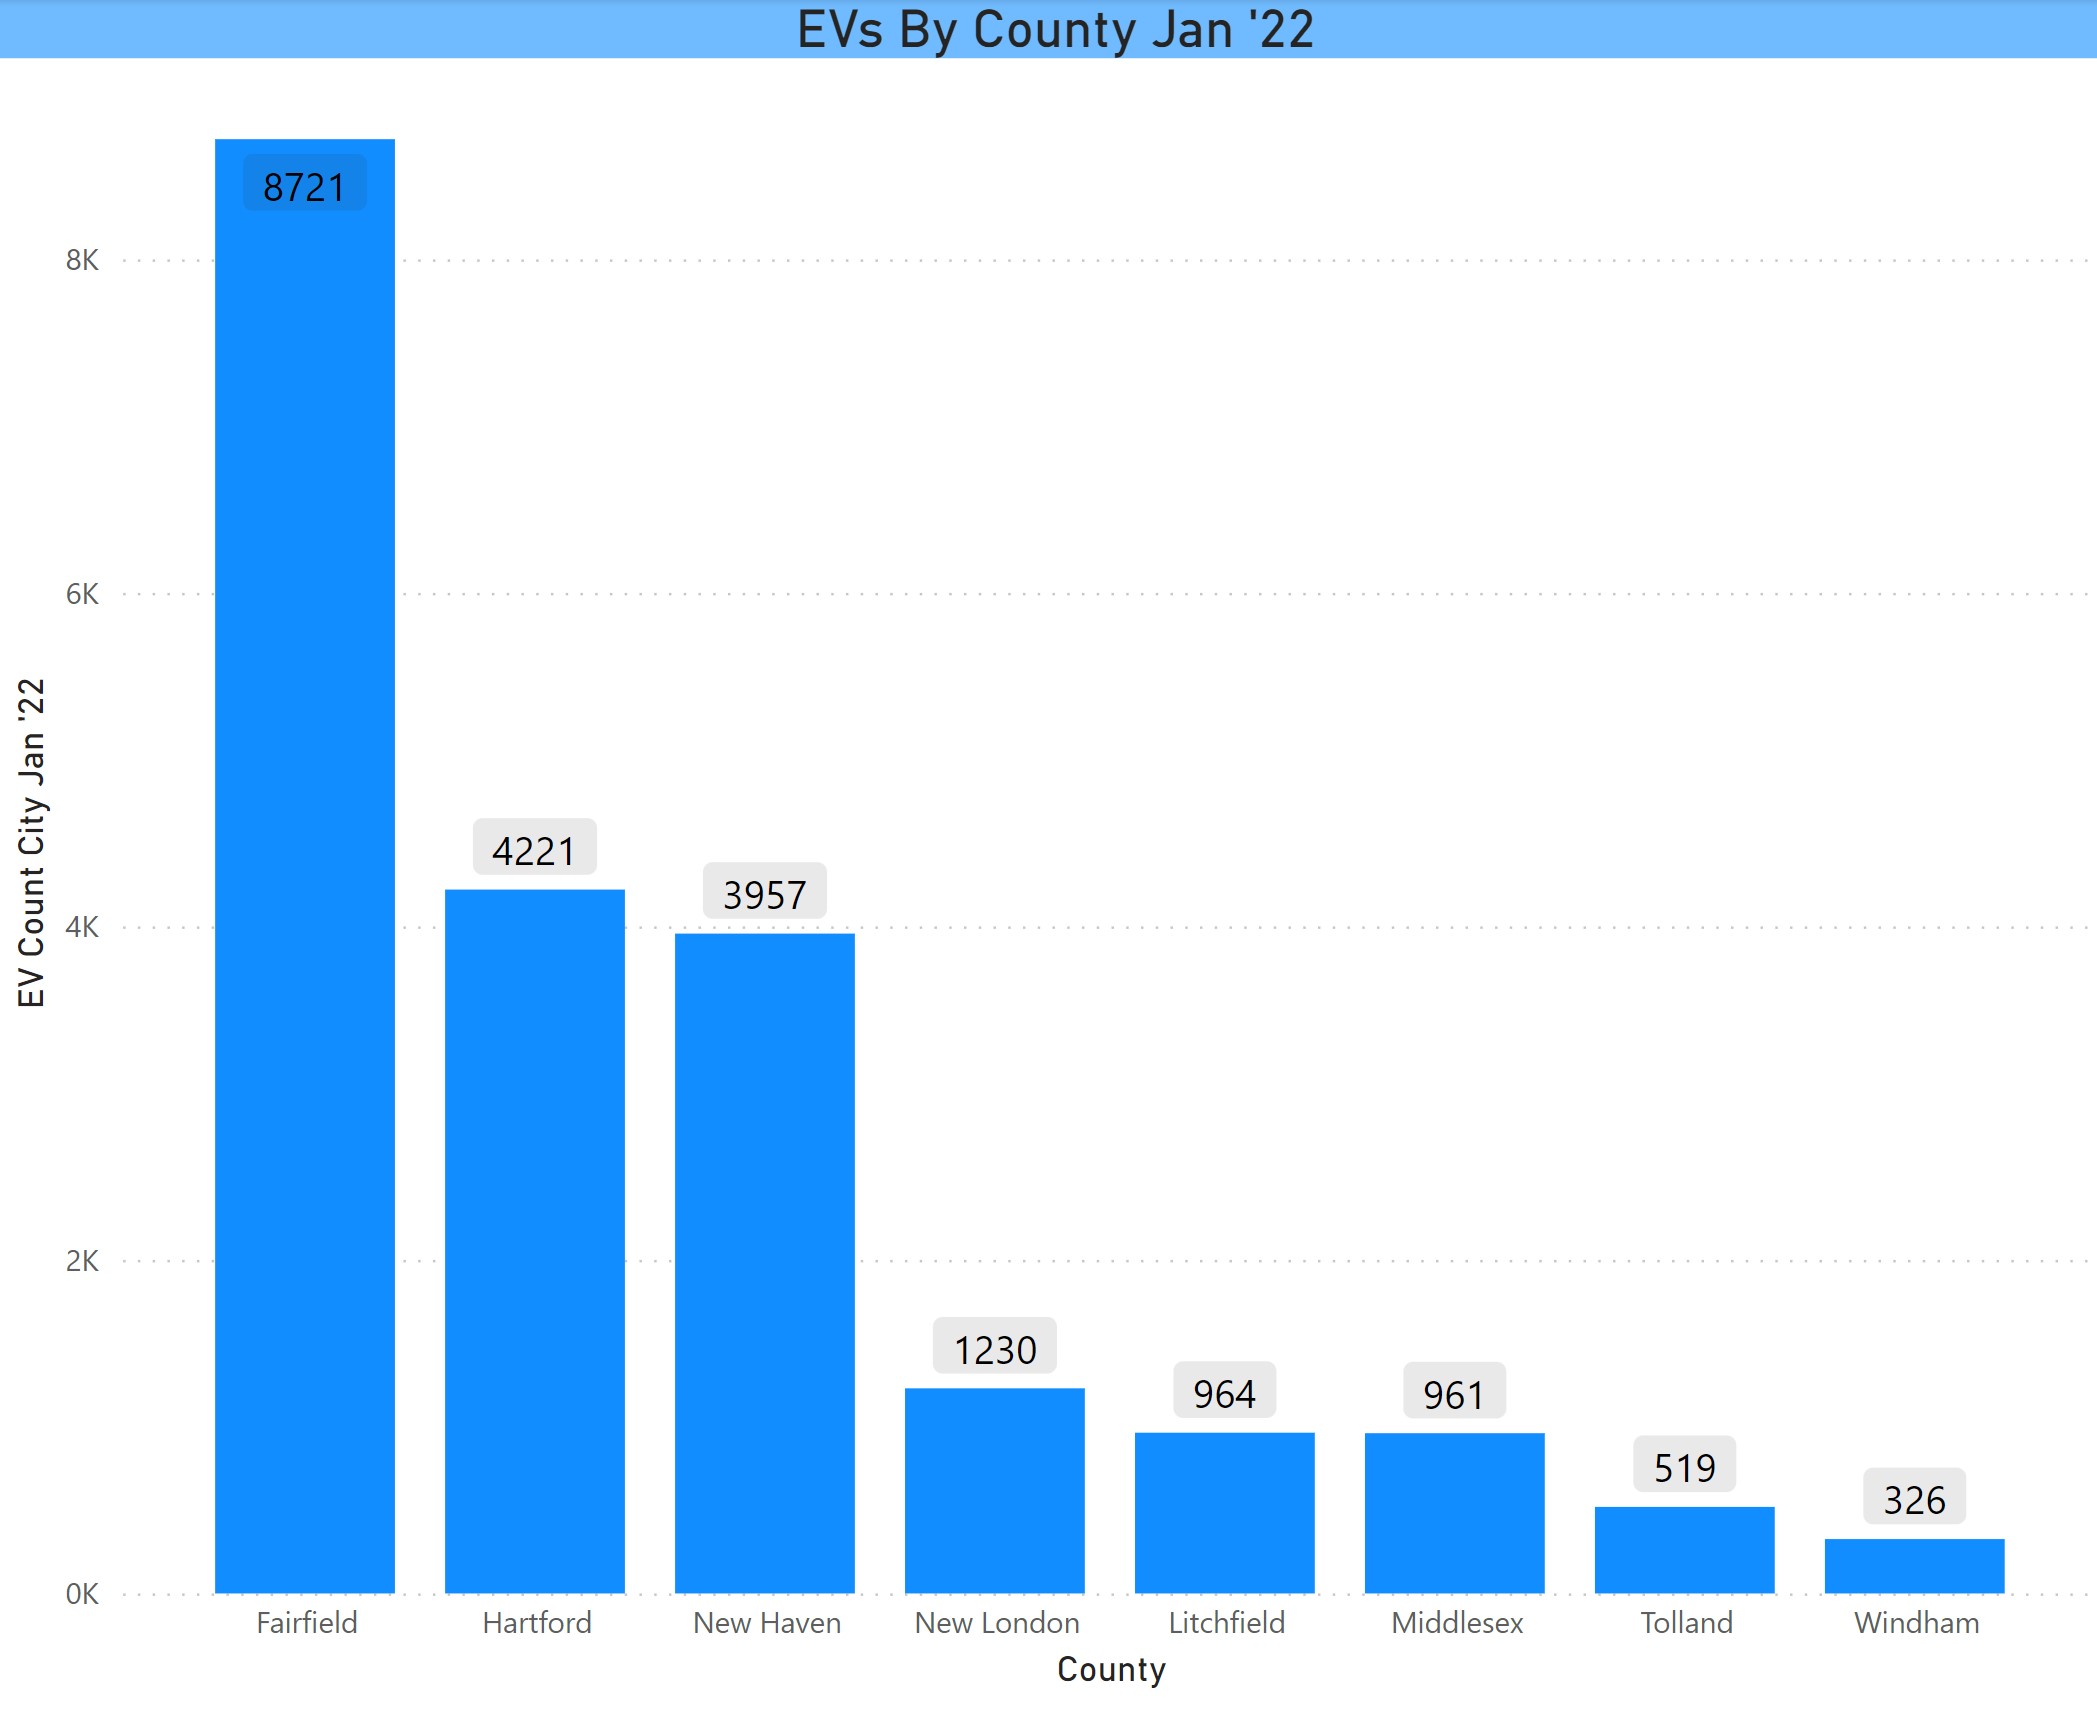
In terms of raw numbers.
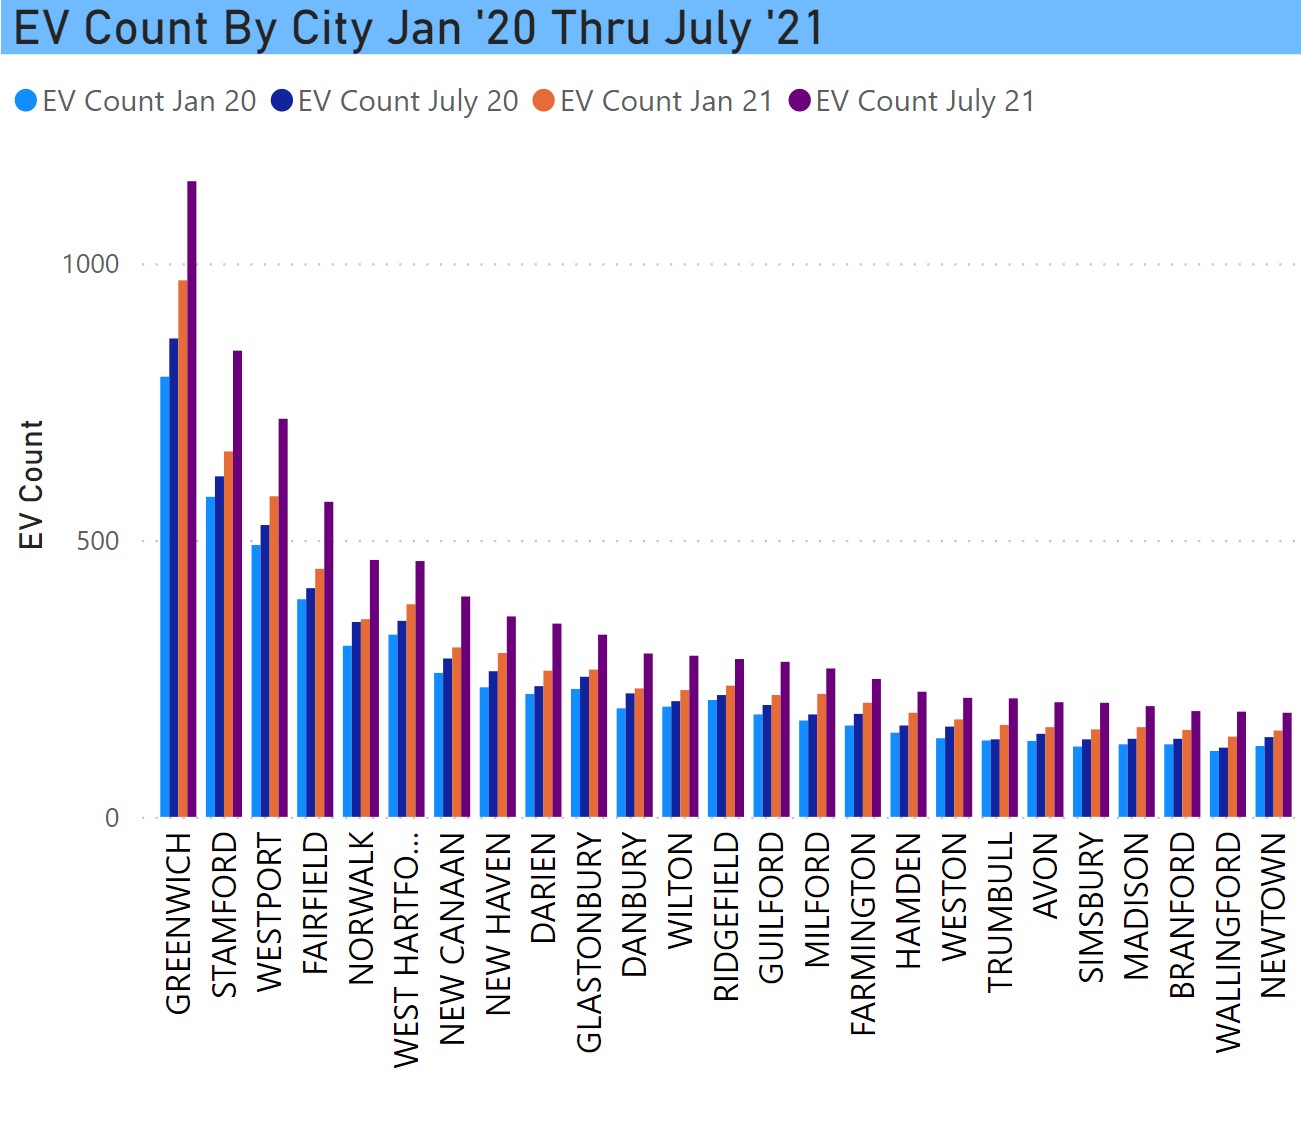
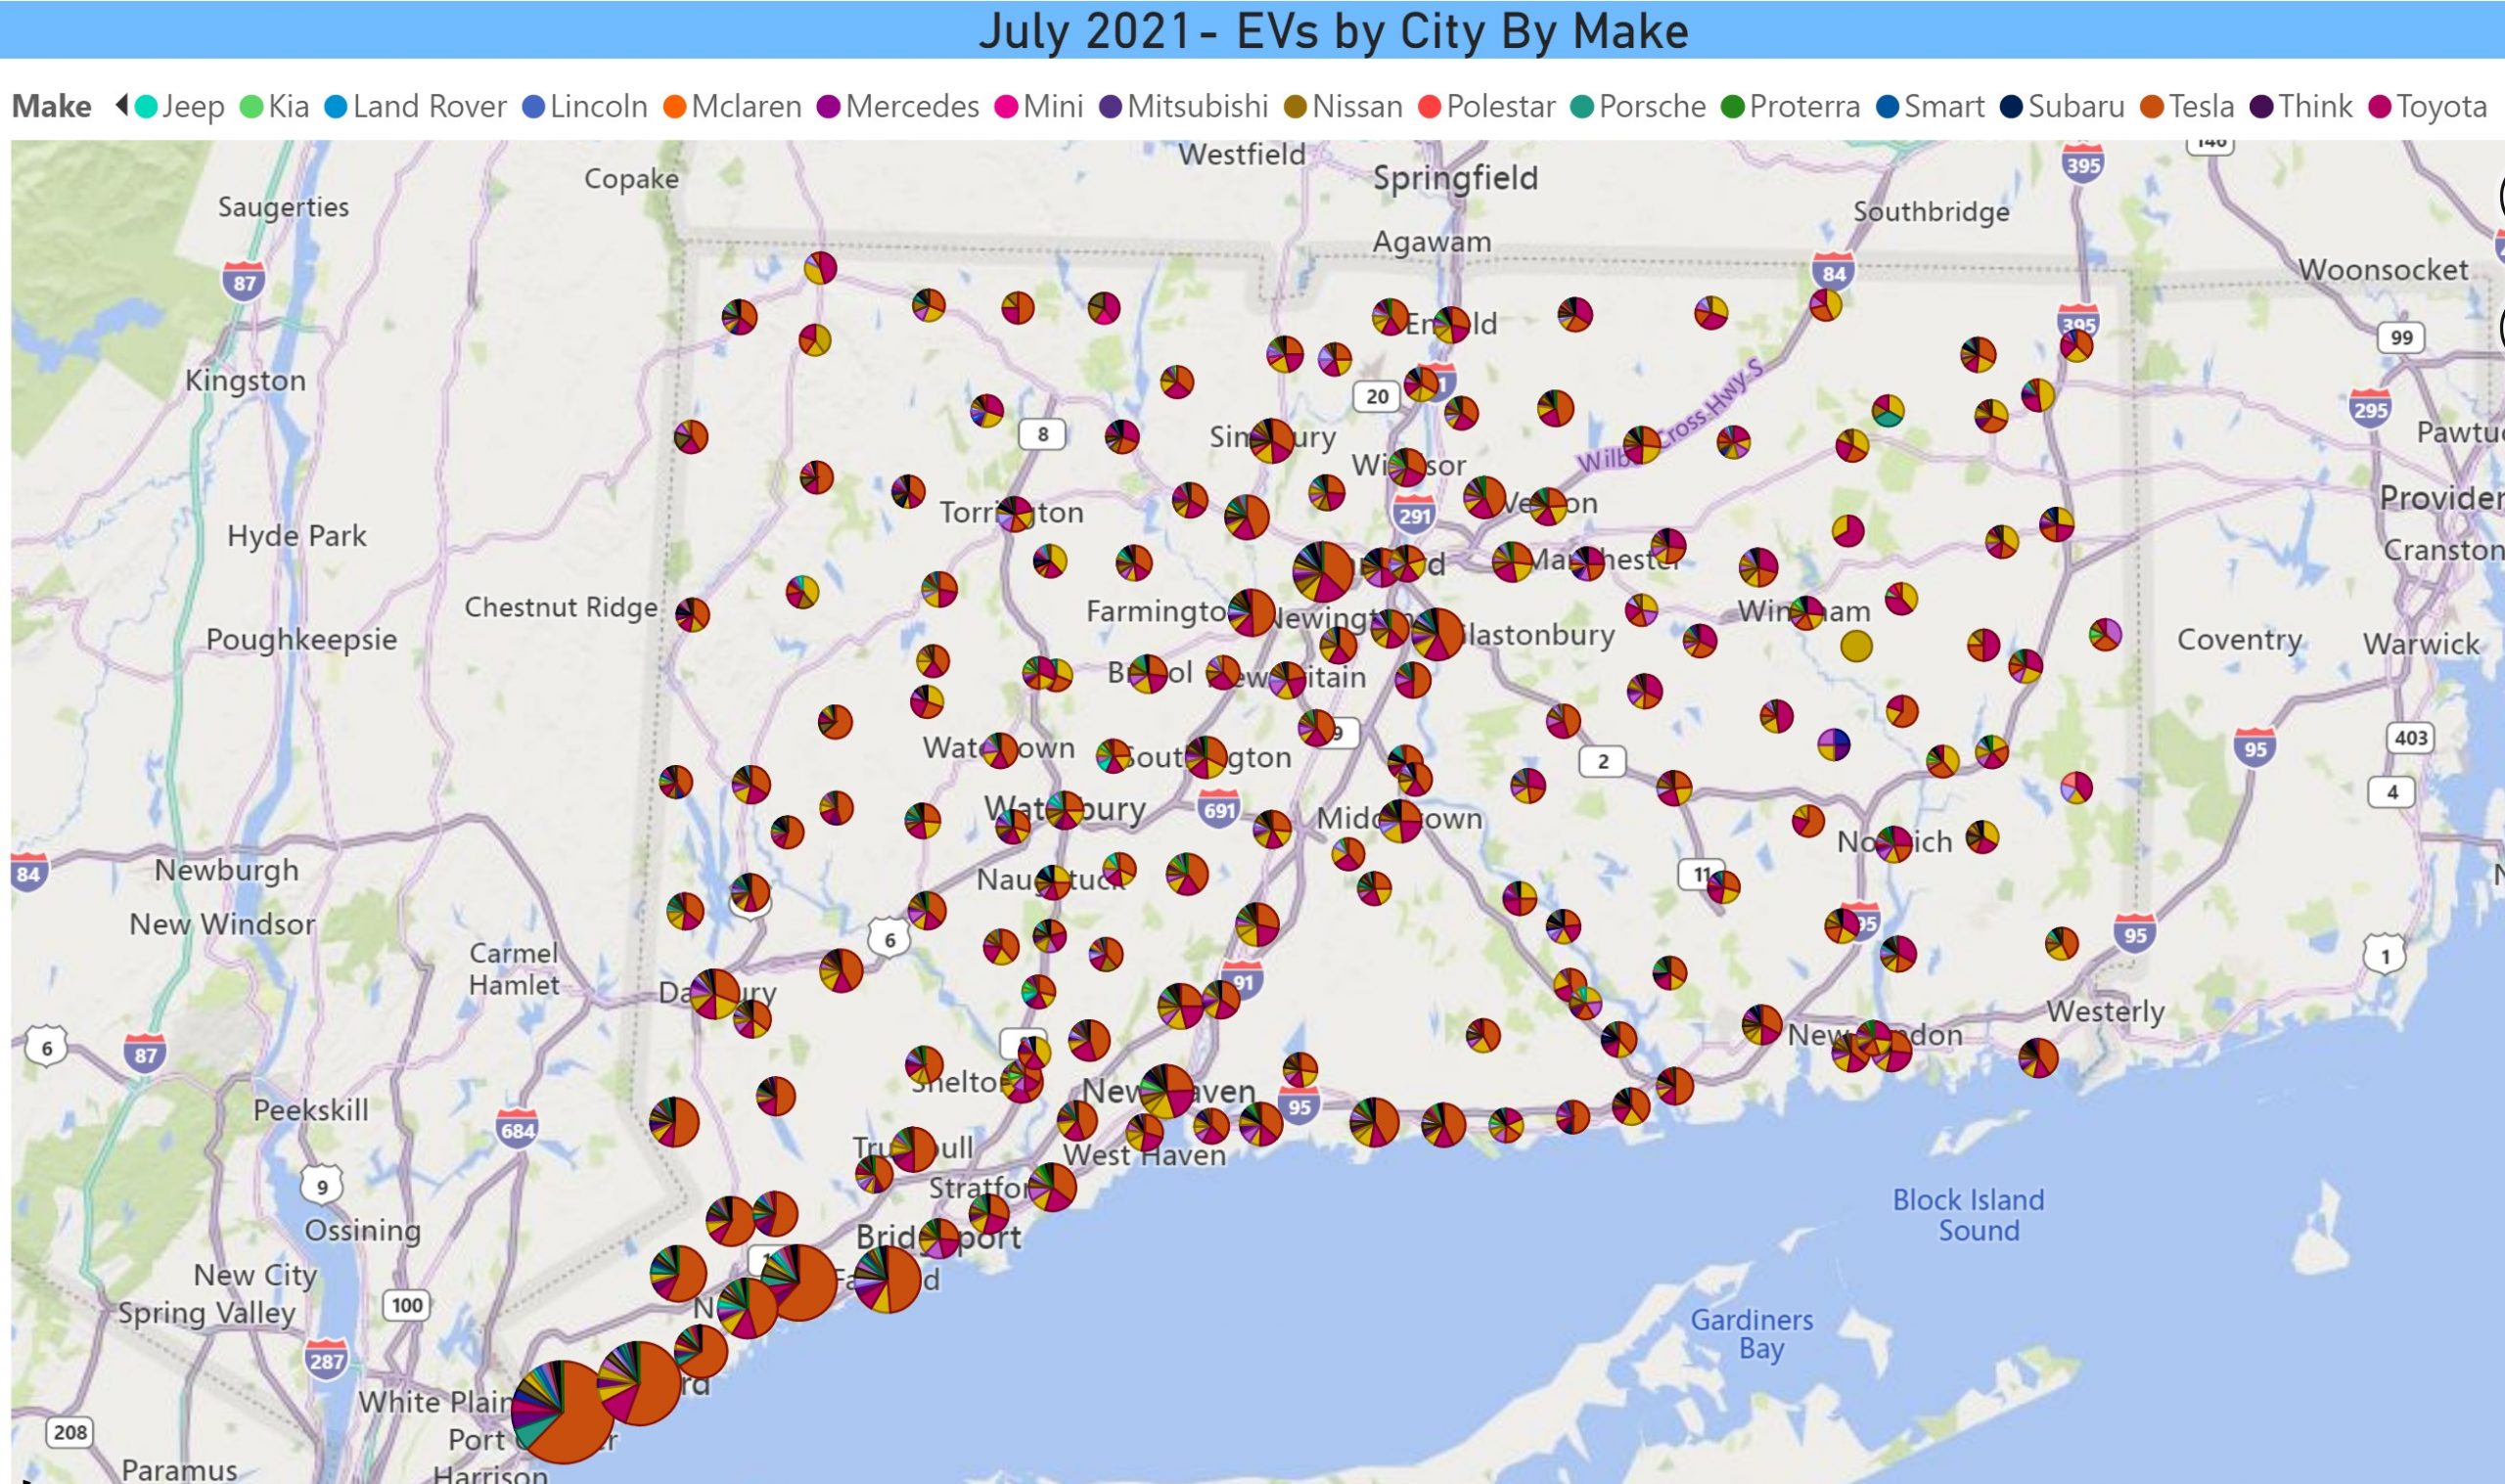
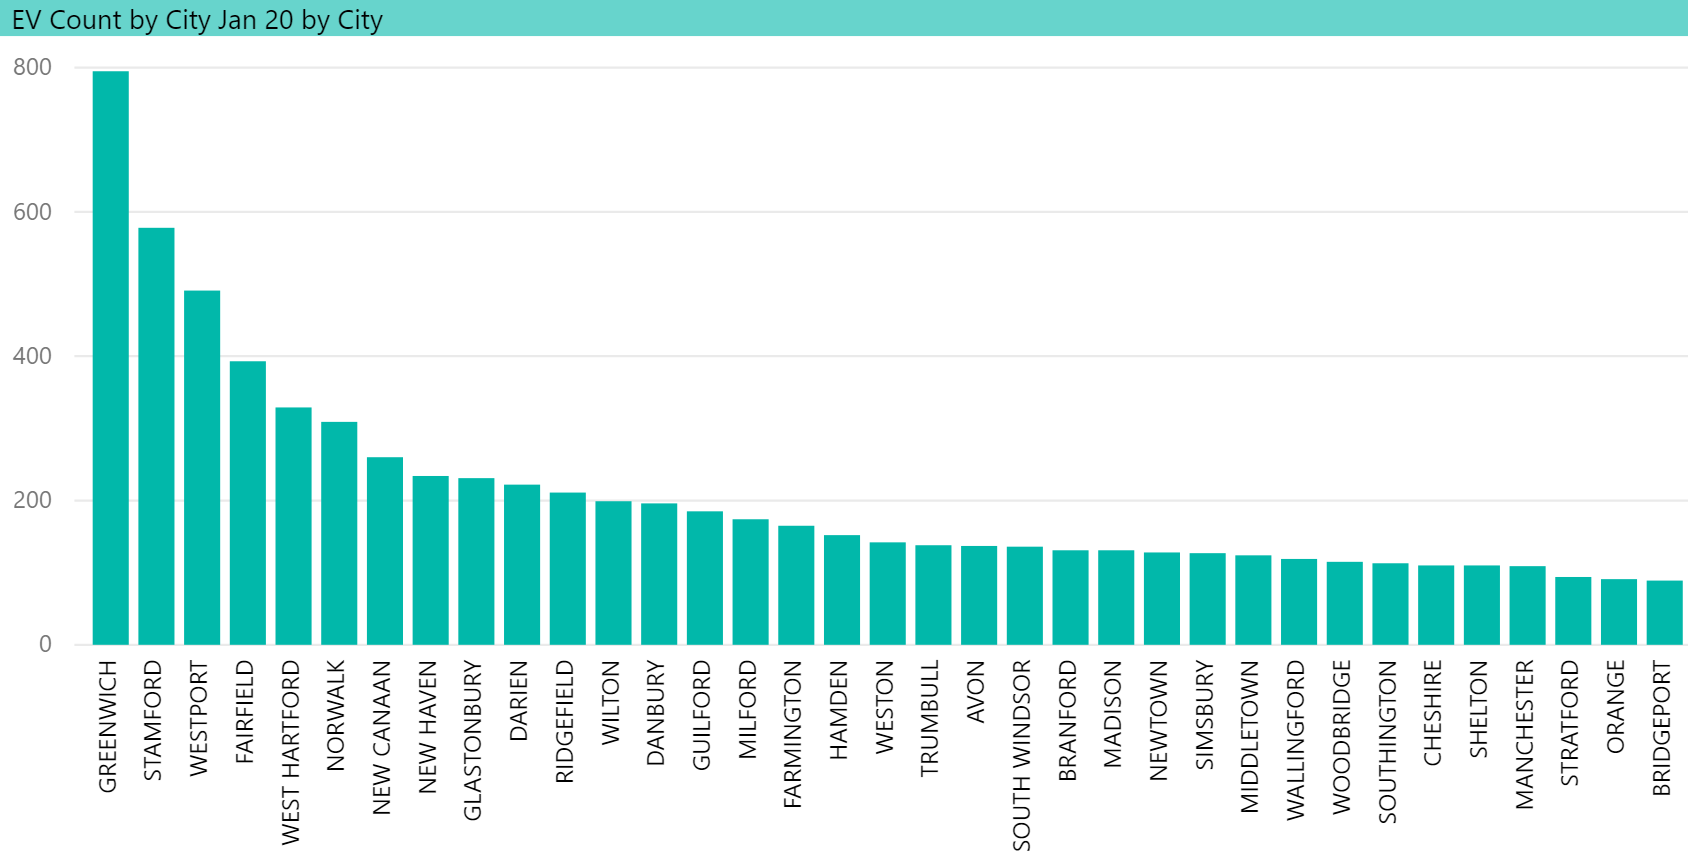
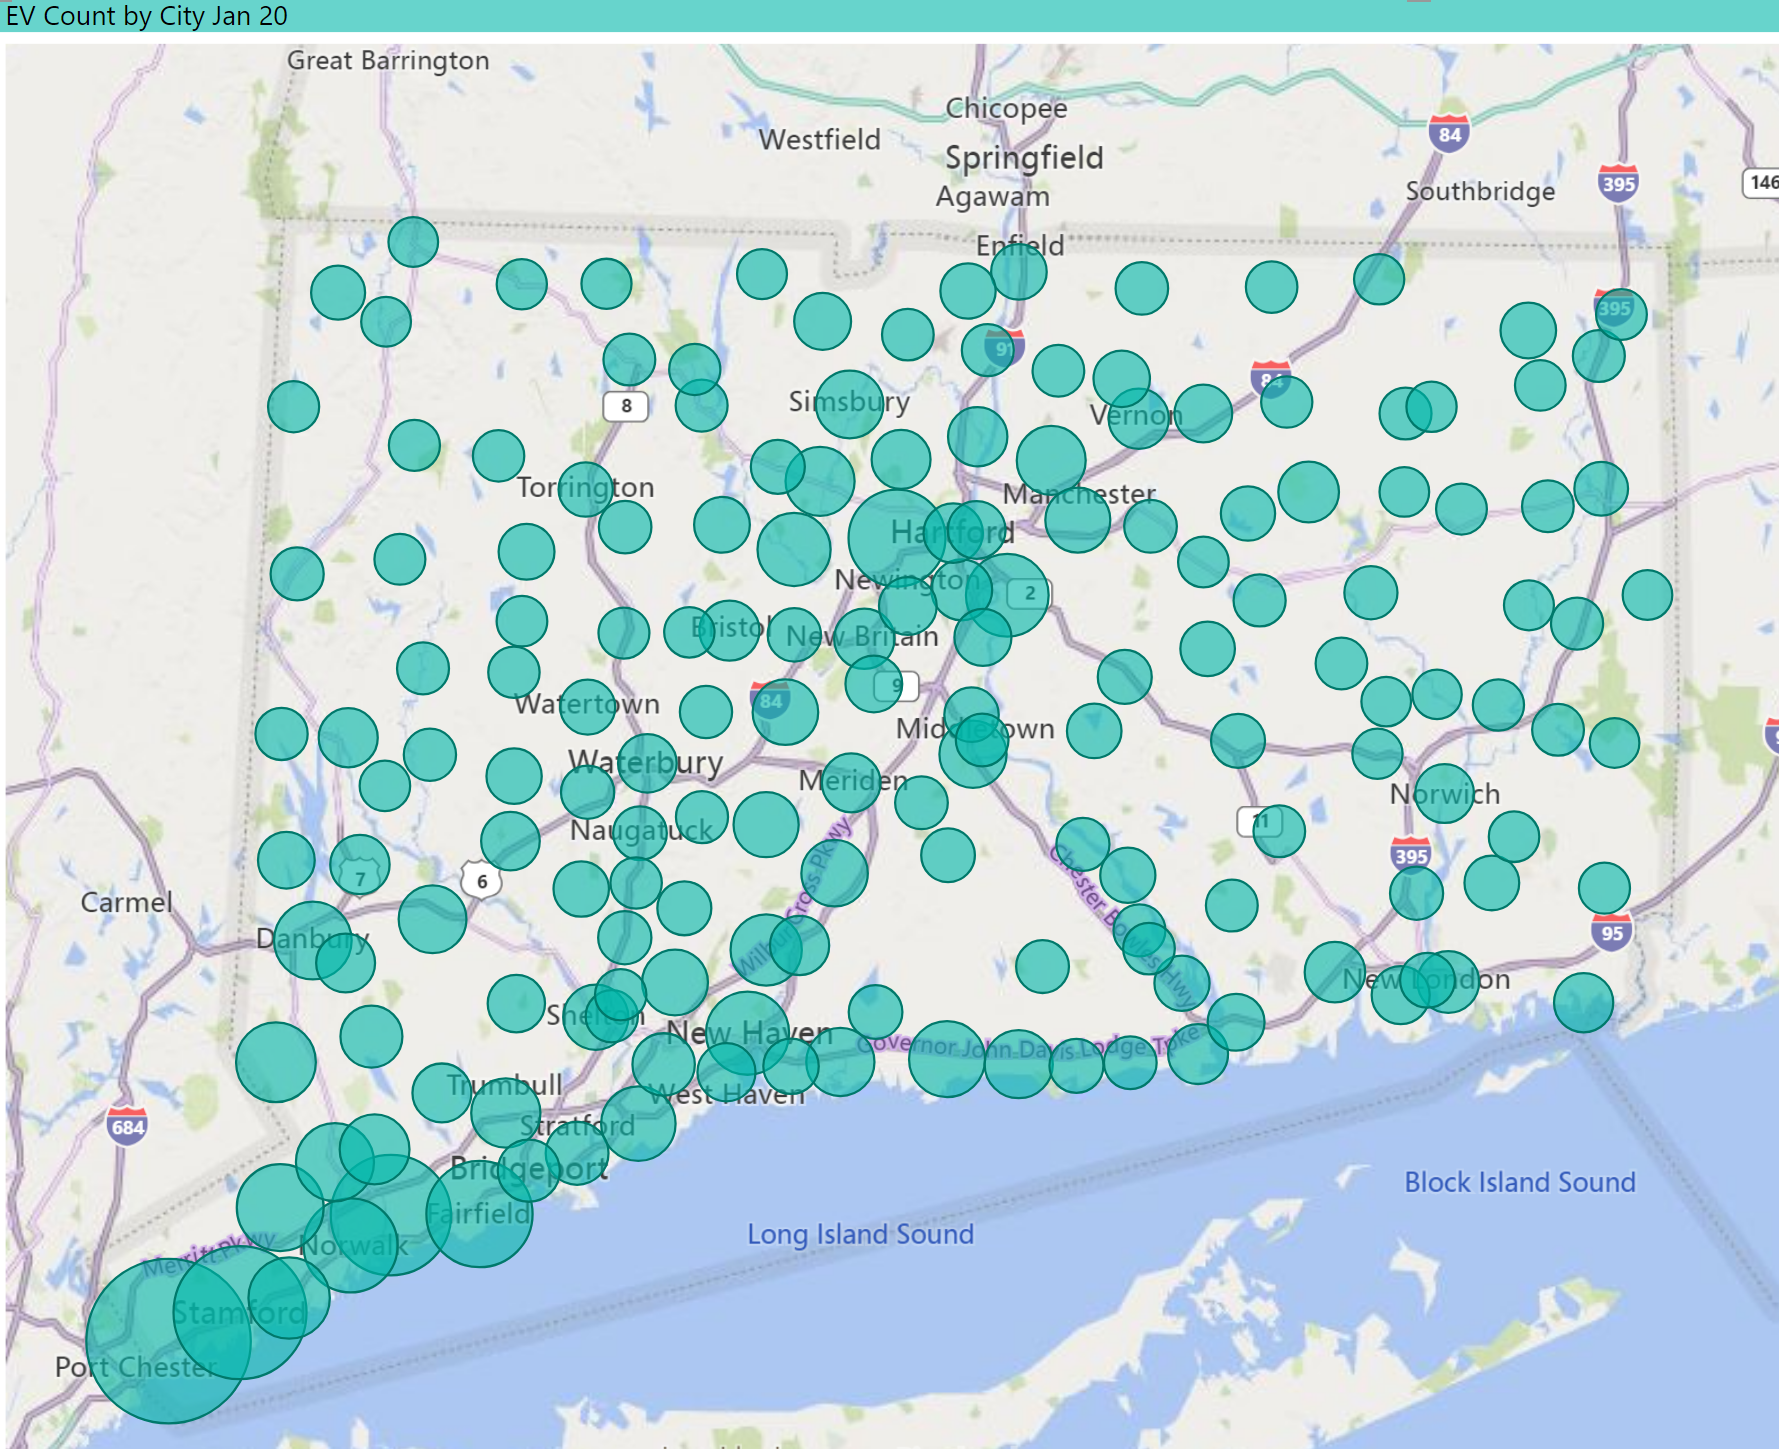
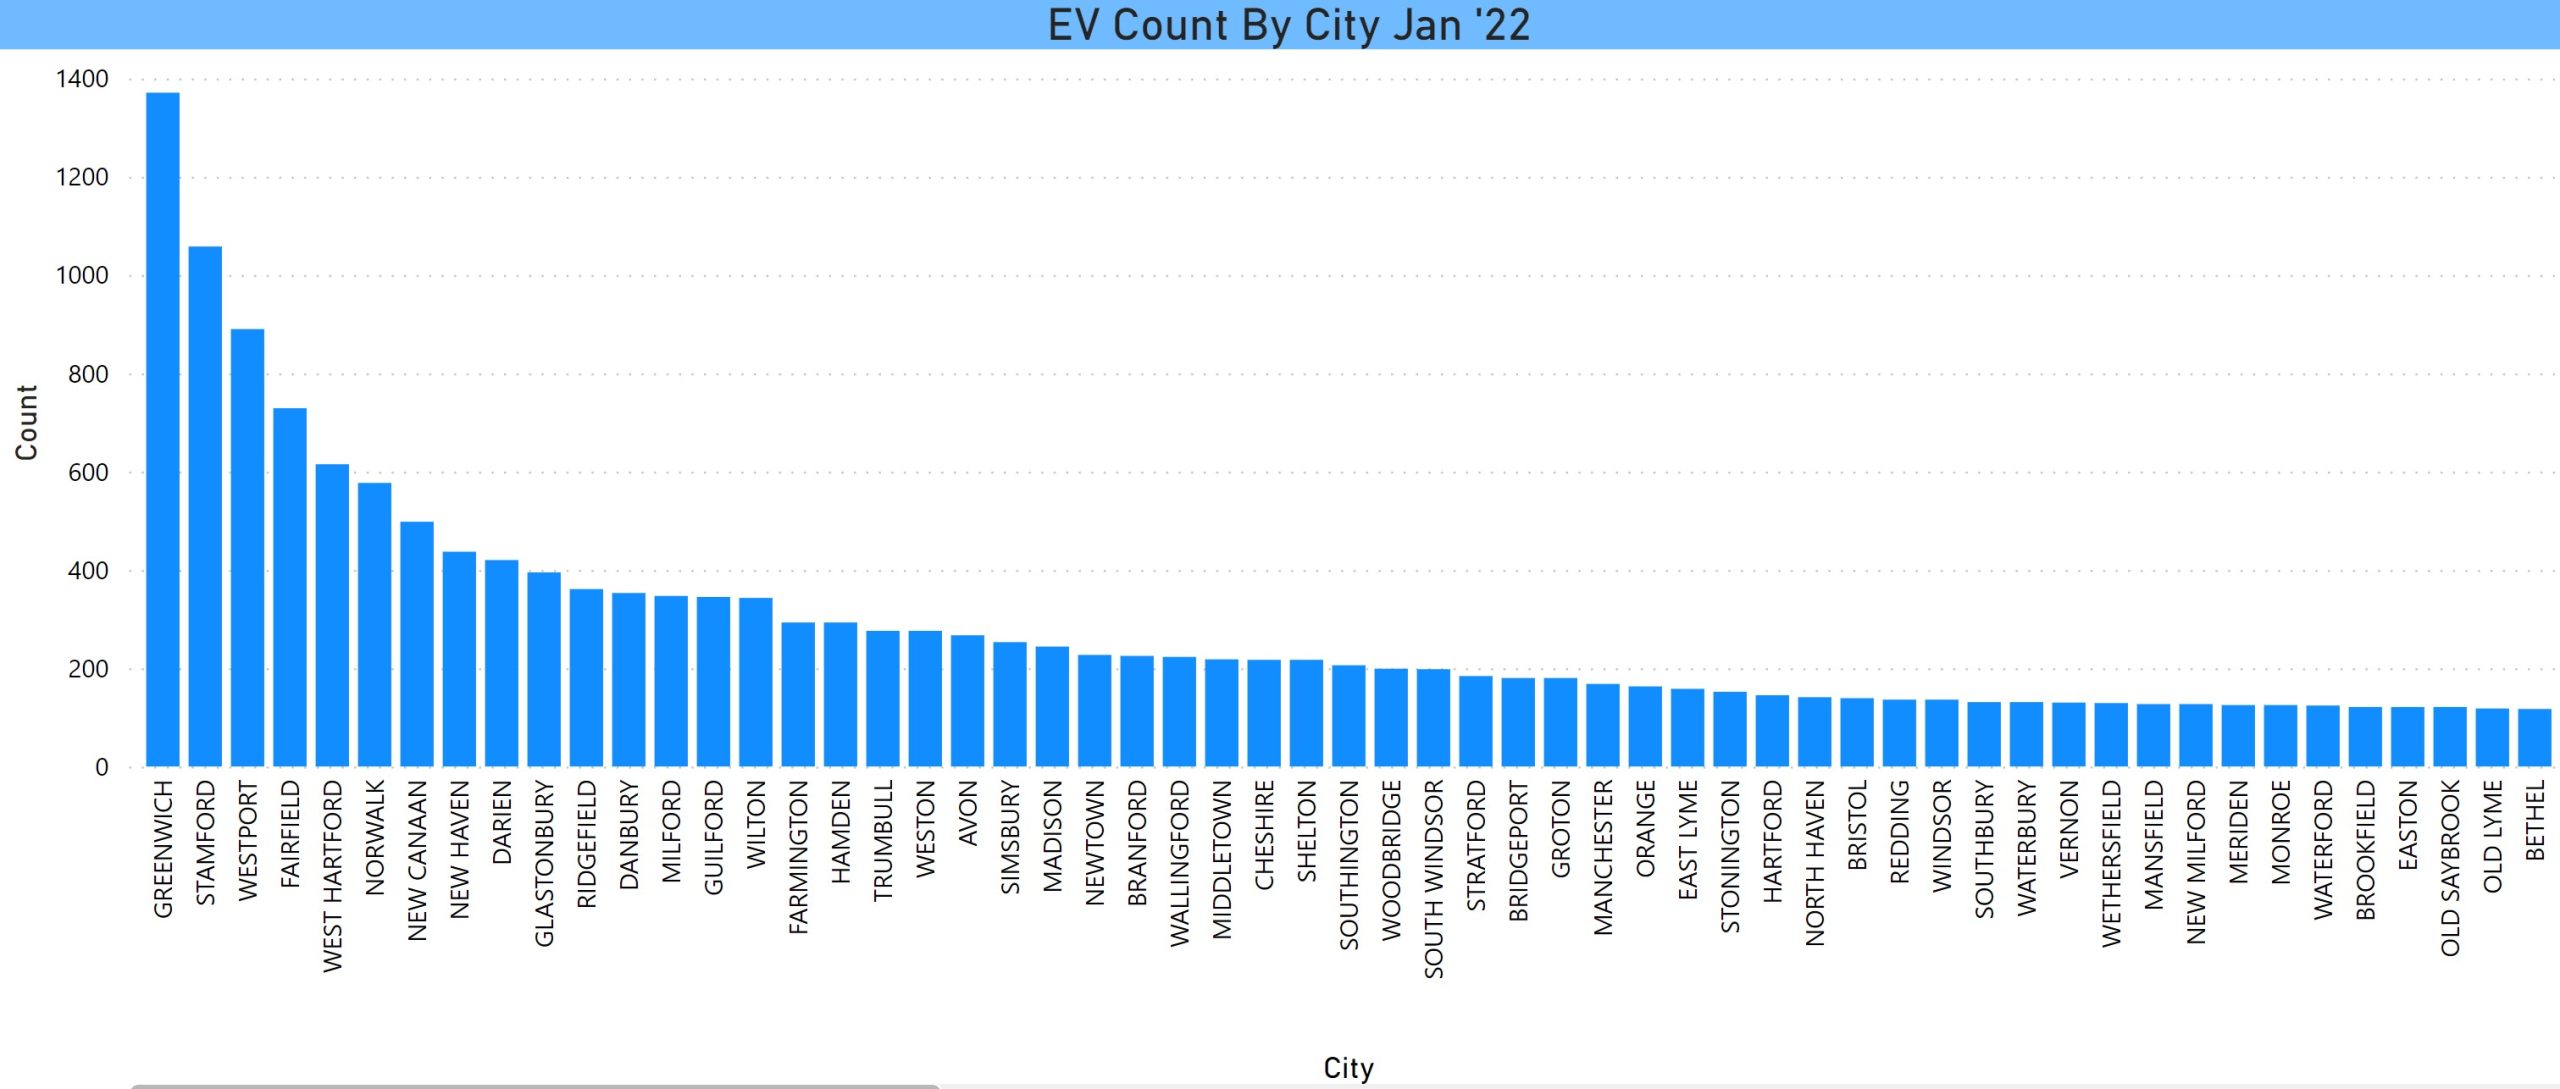
EVs by City
In the map at the top of the post the bubbles are sized for the number of EVs in each city and the intensity of the color saturation deepens with higher EVs per capita. Below is a bar graph excerpt (due to space limitations of the cities with the highest EV count. Top cities are Greenwich (1371), Stamford (1058), Westport (890), Fairfield (729), and West Hartford (615).
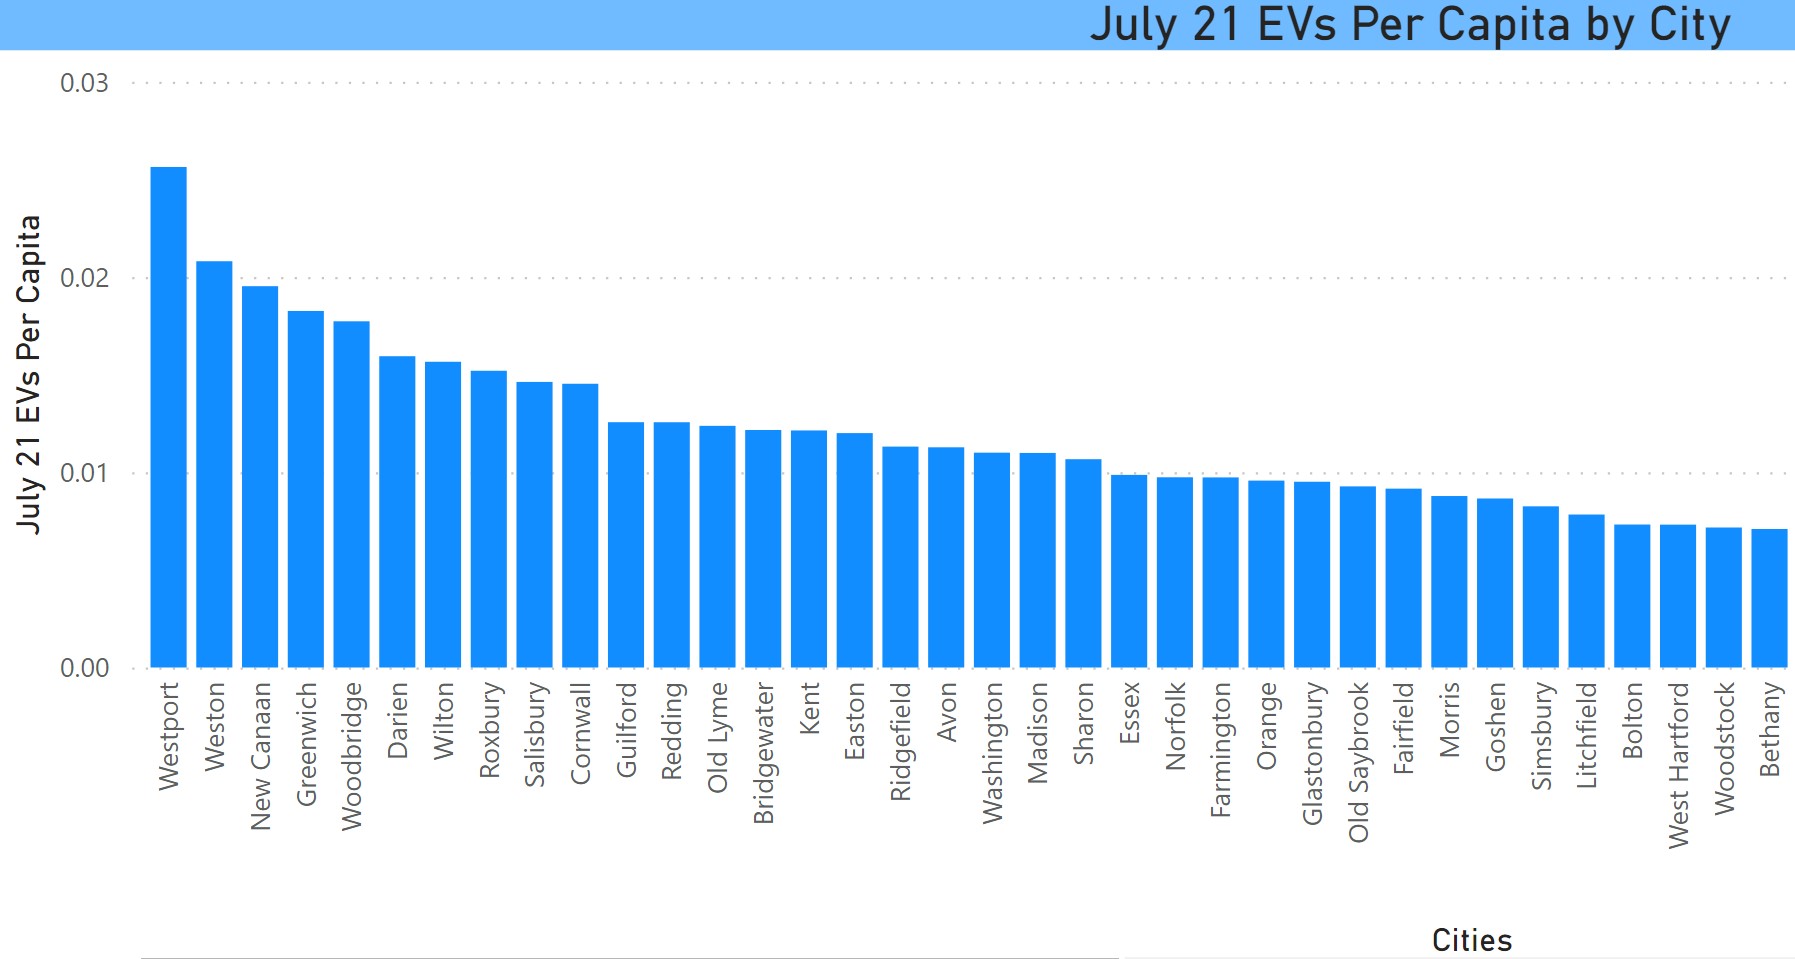
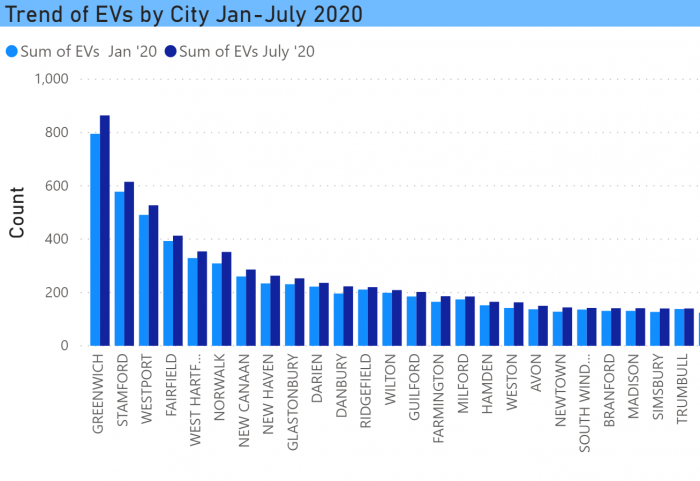
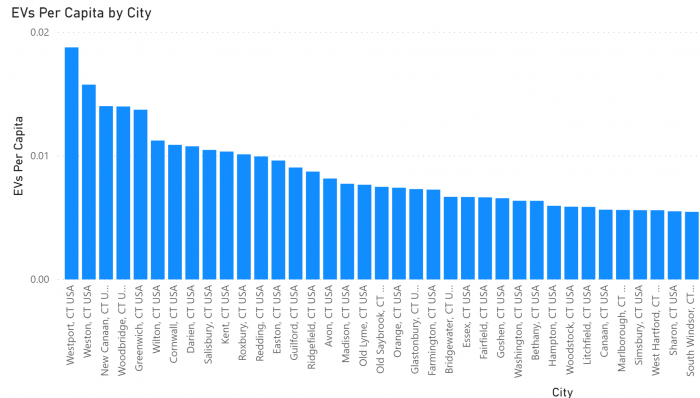
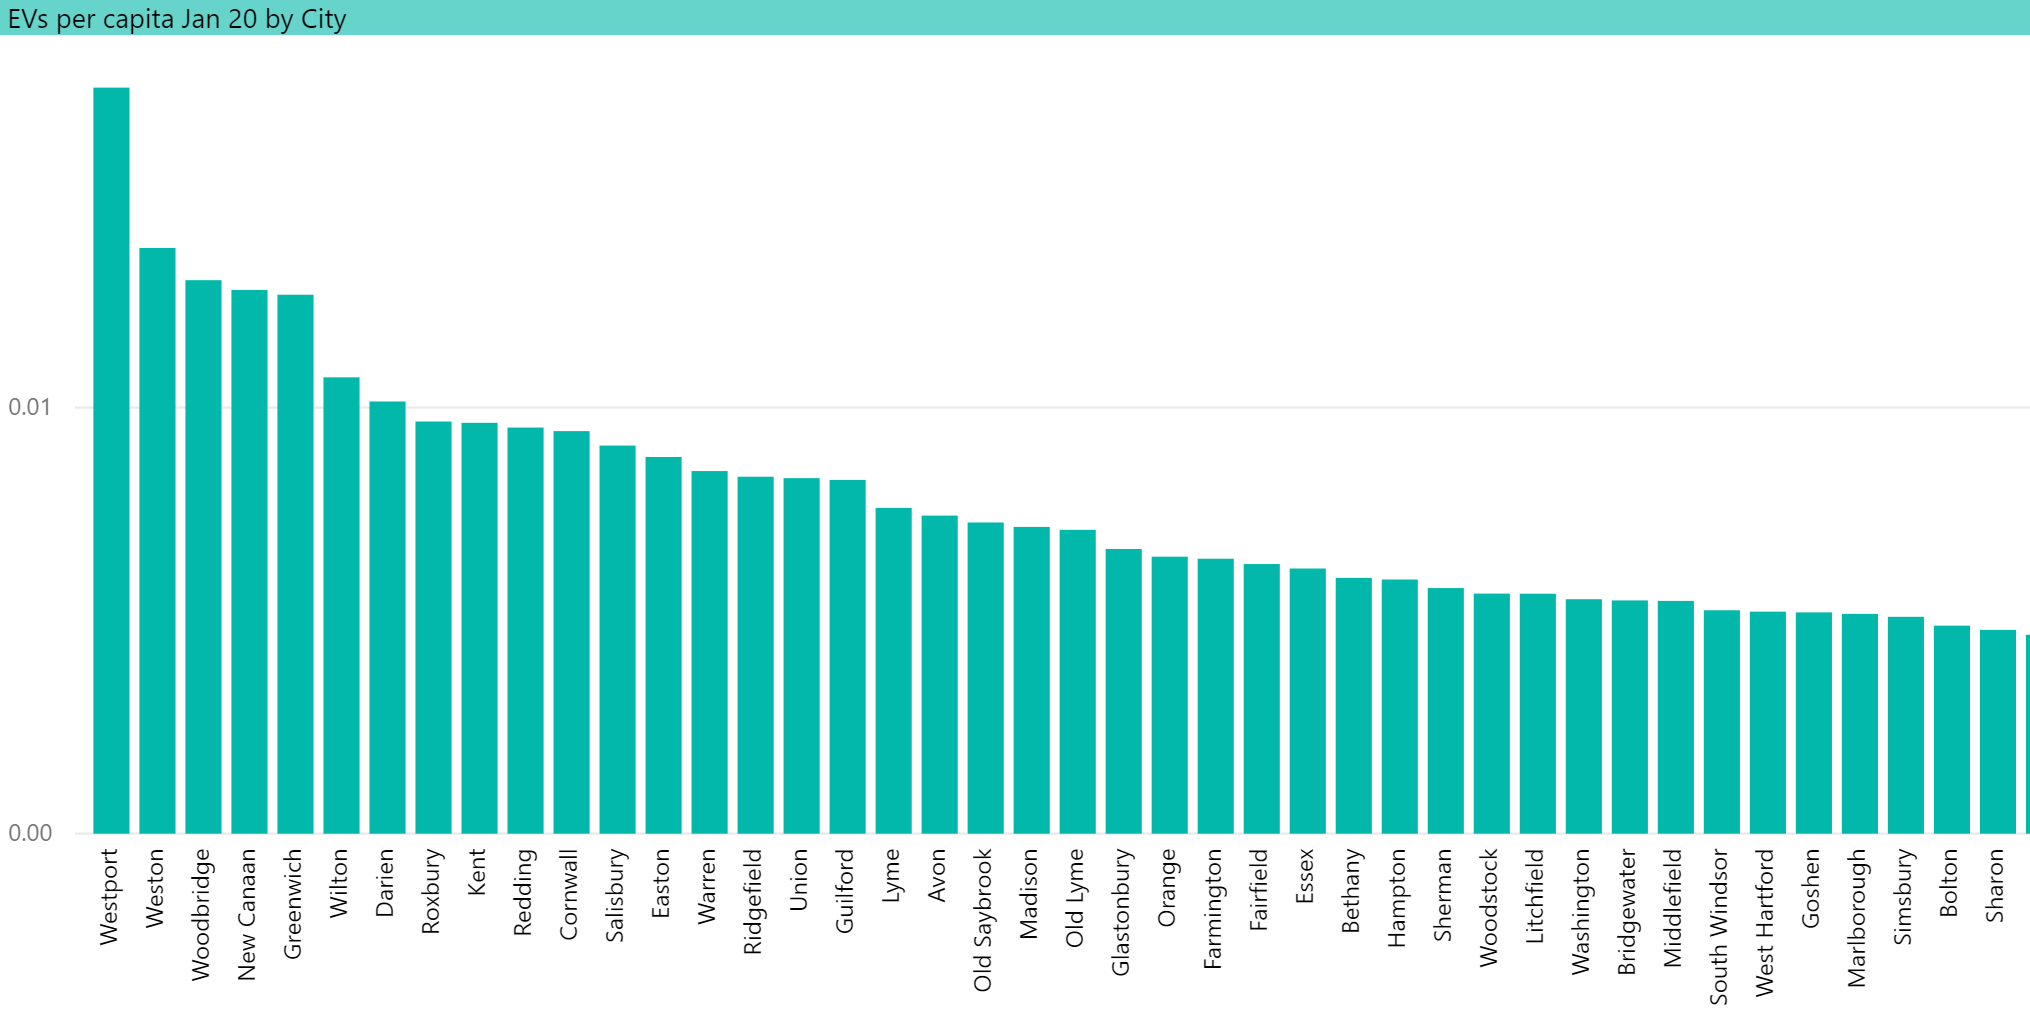
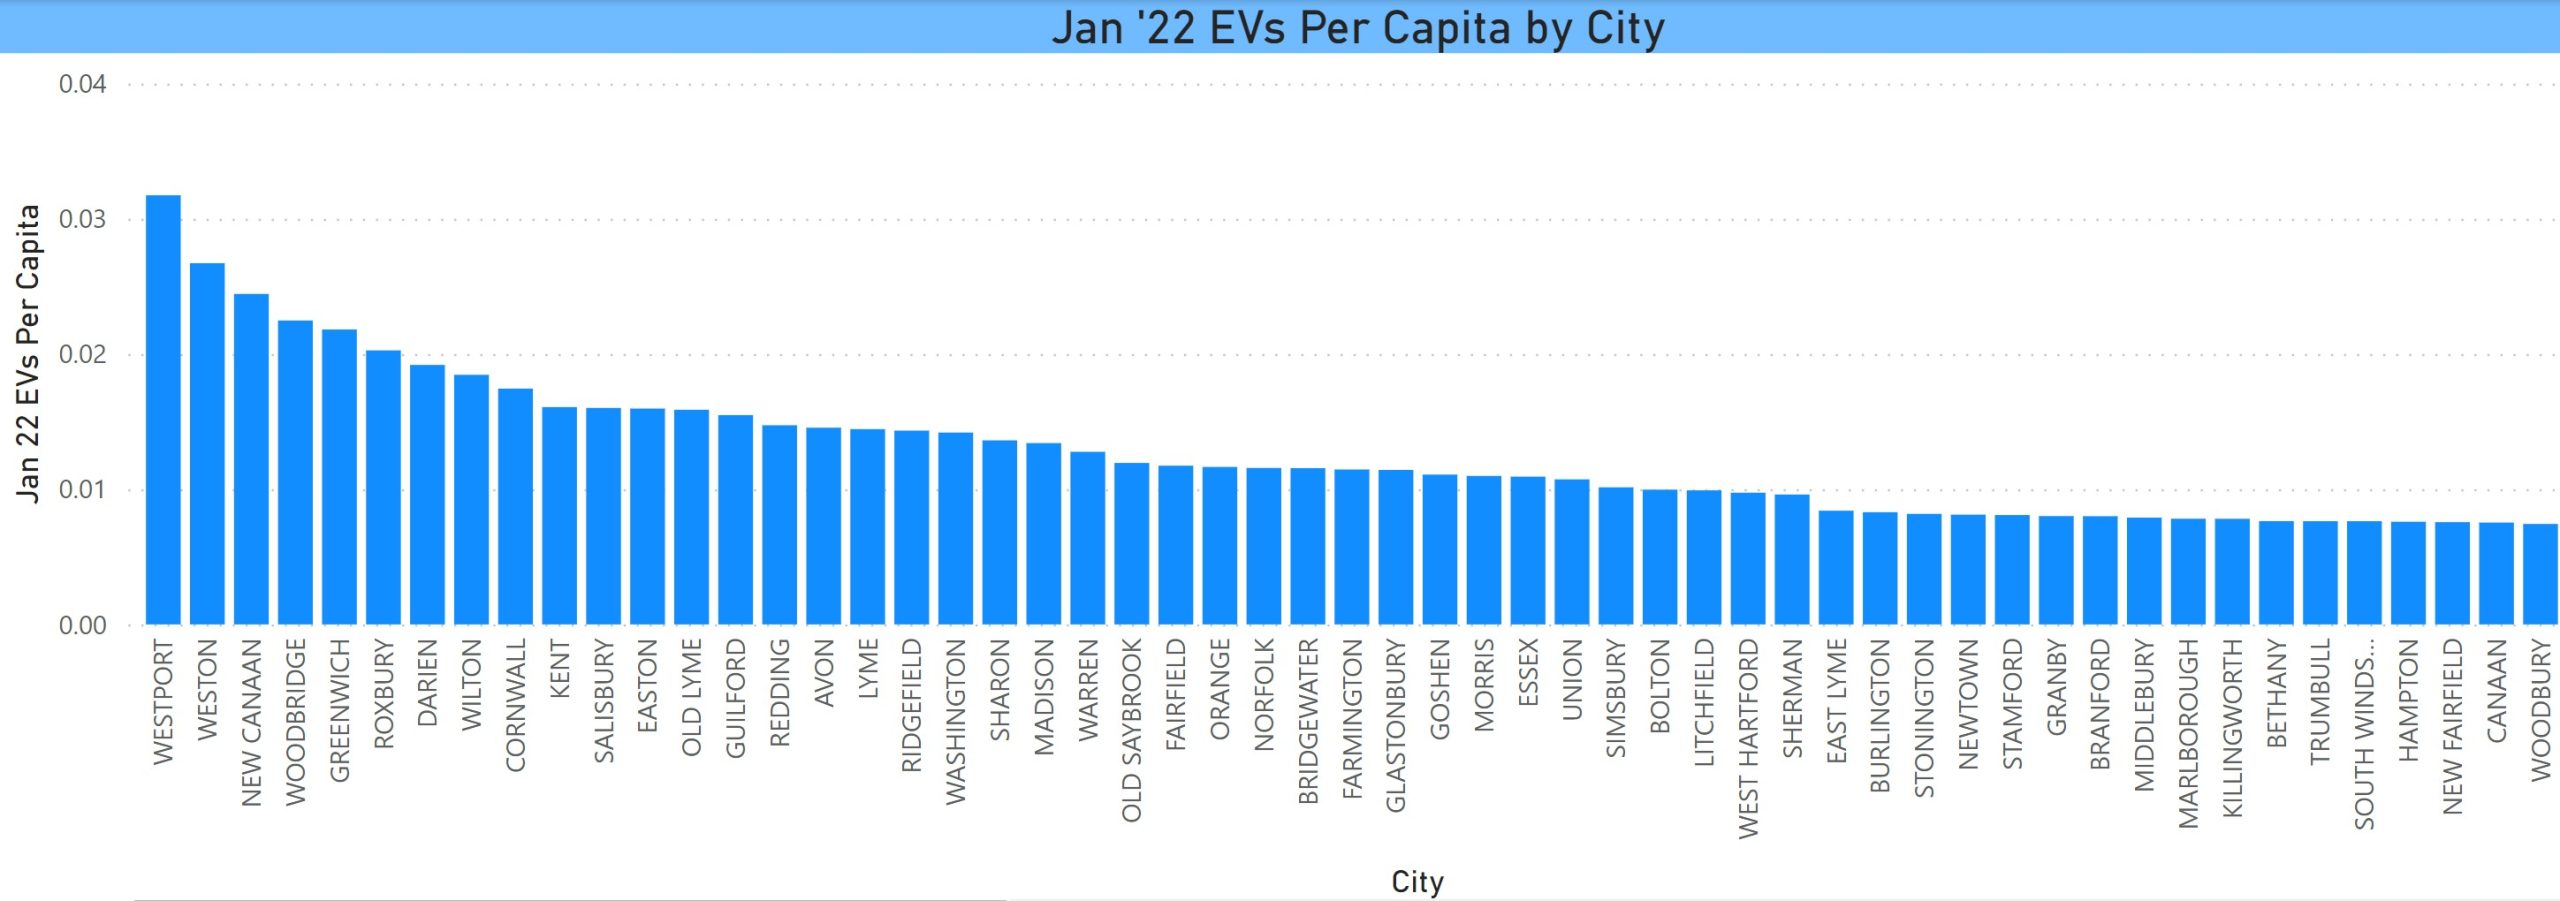
EVs Per Capita by City
A number of the smaller cities, particularly in Fairfield County, rise higher in the ranks.
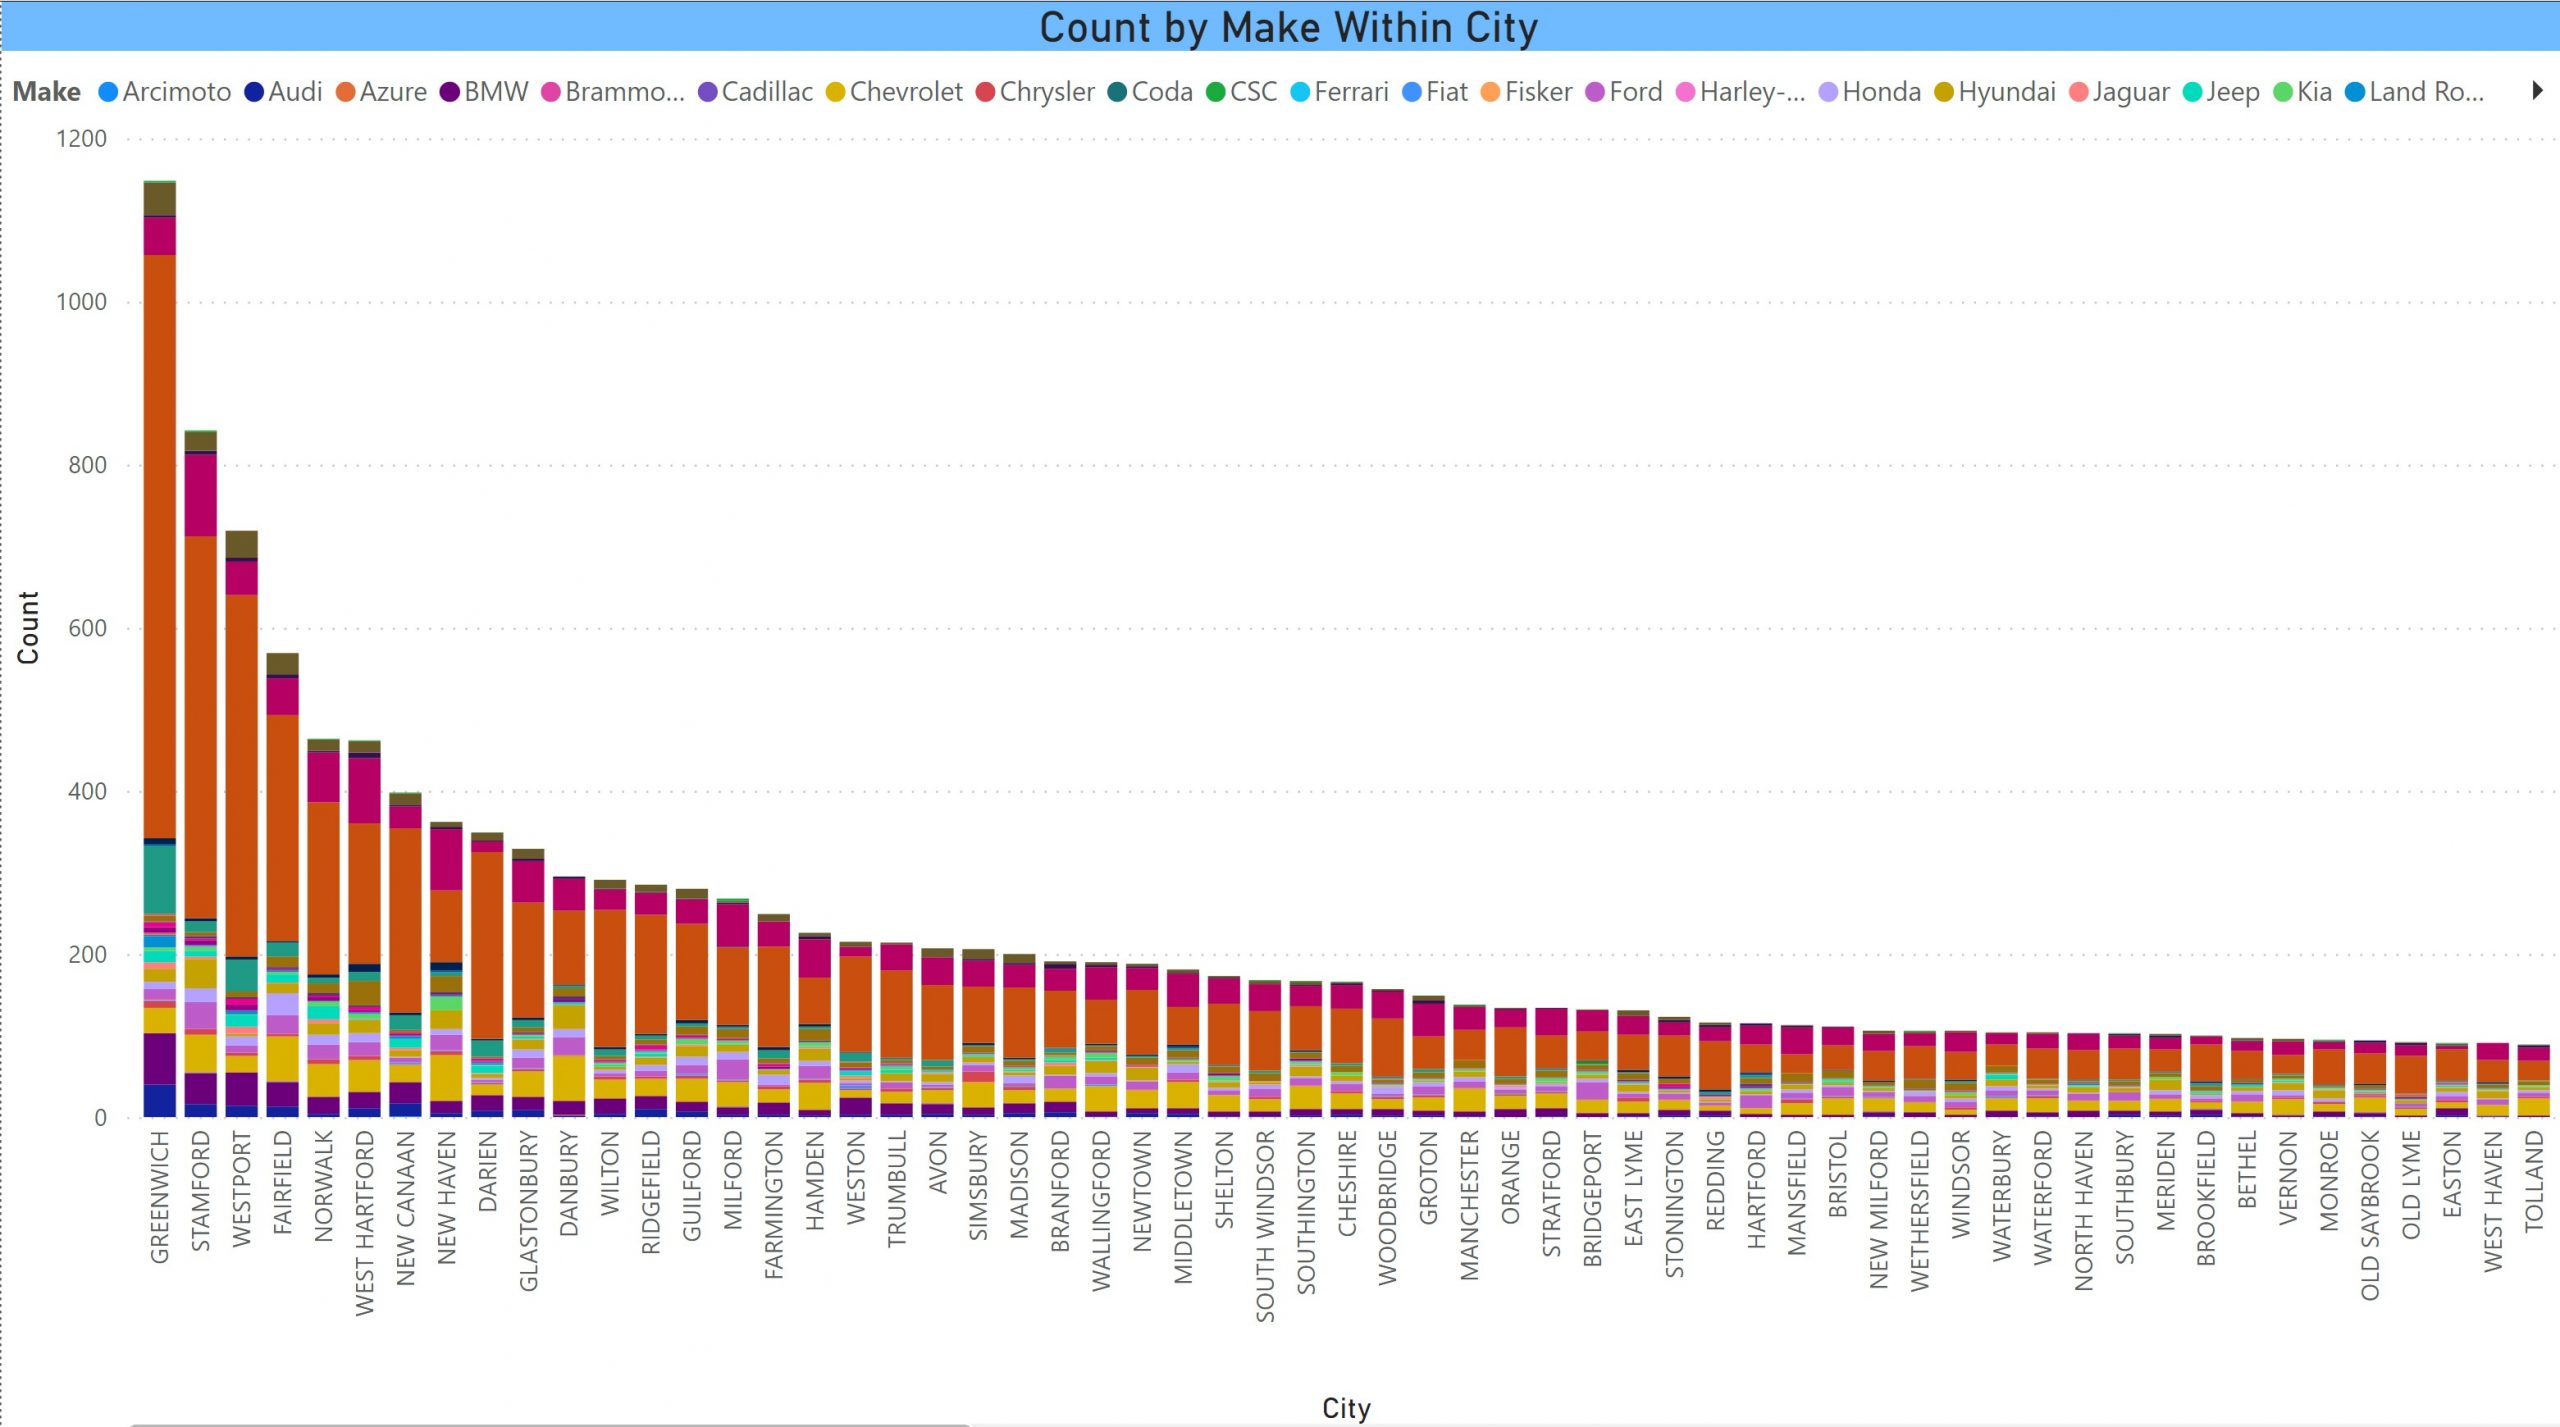
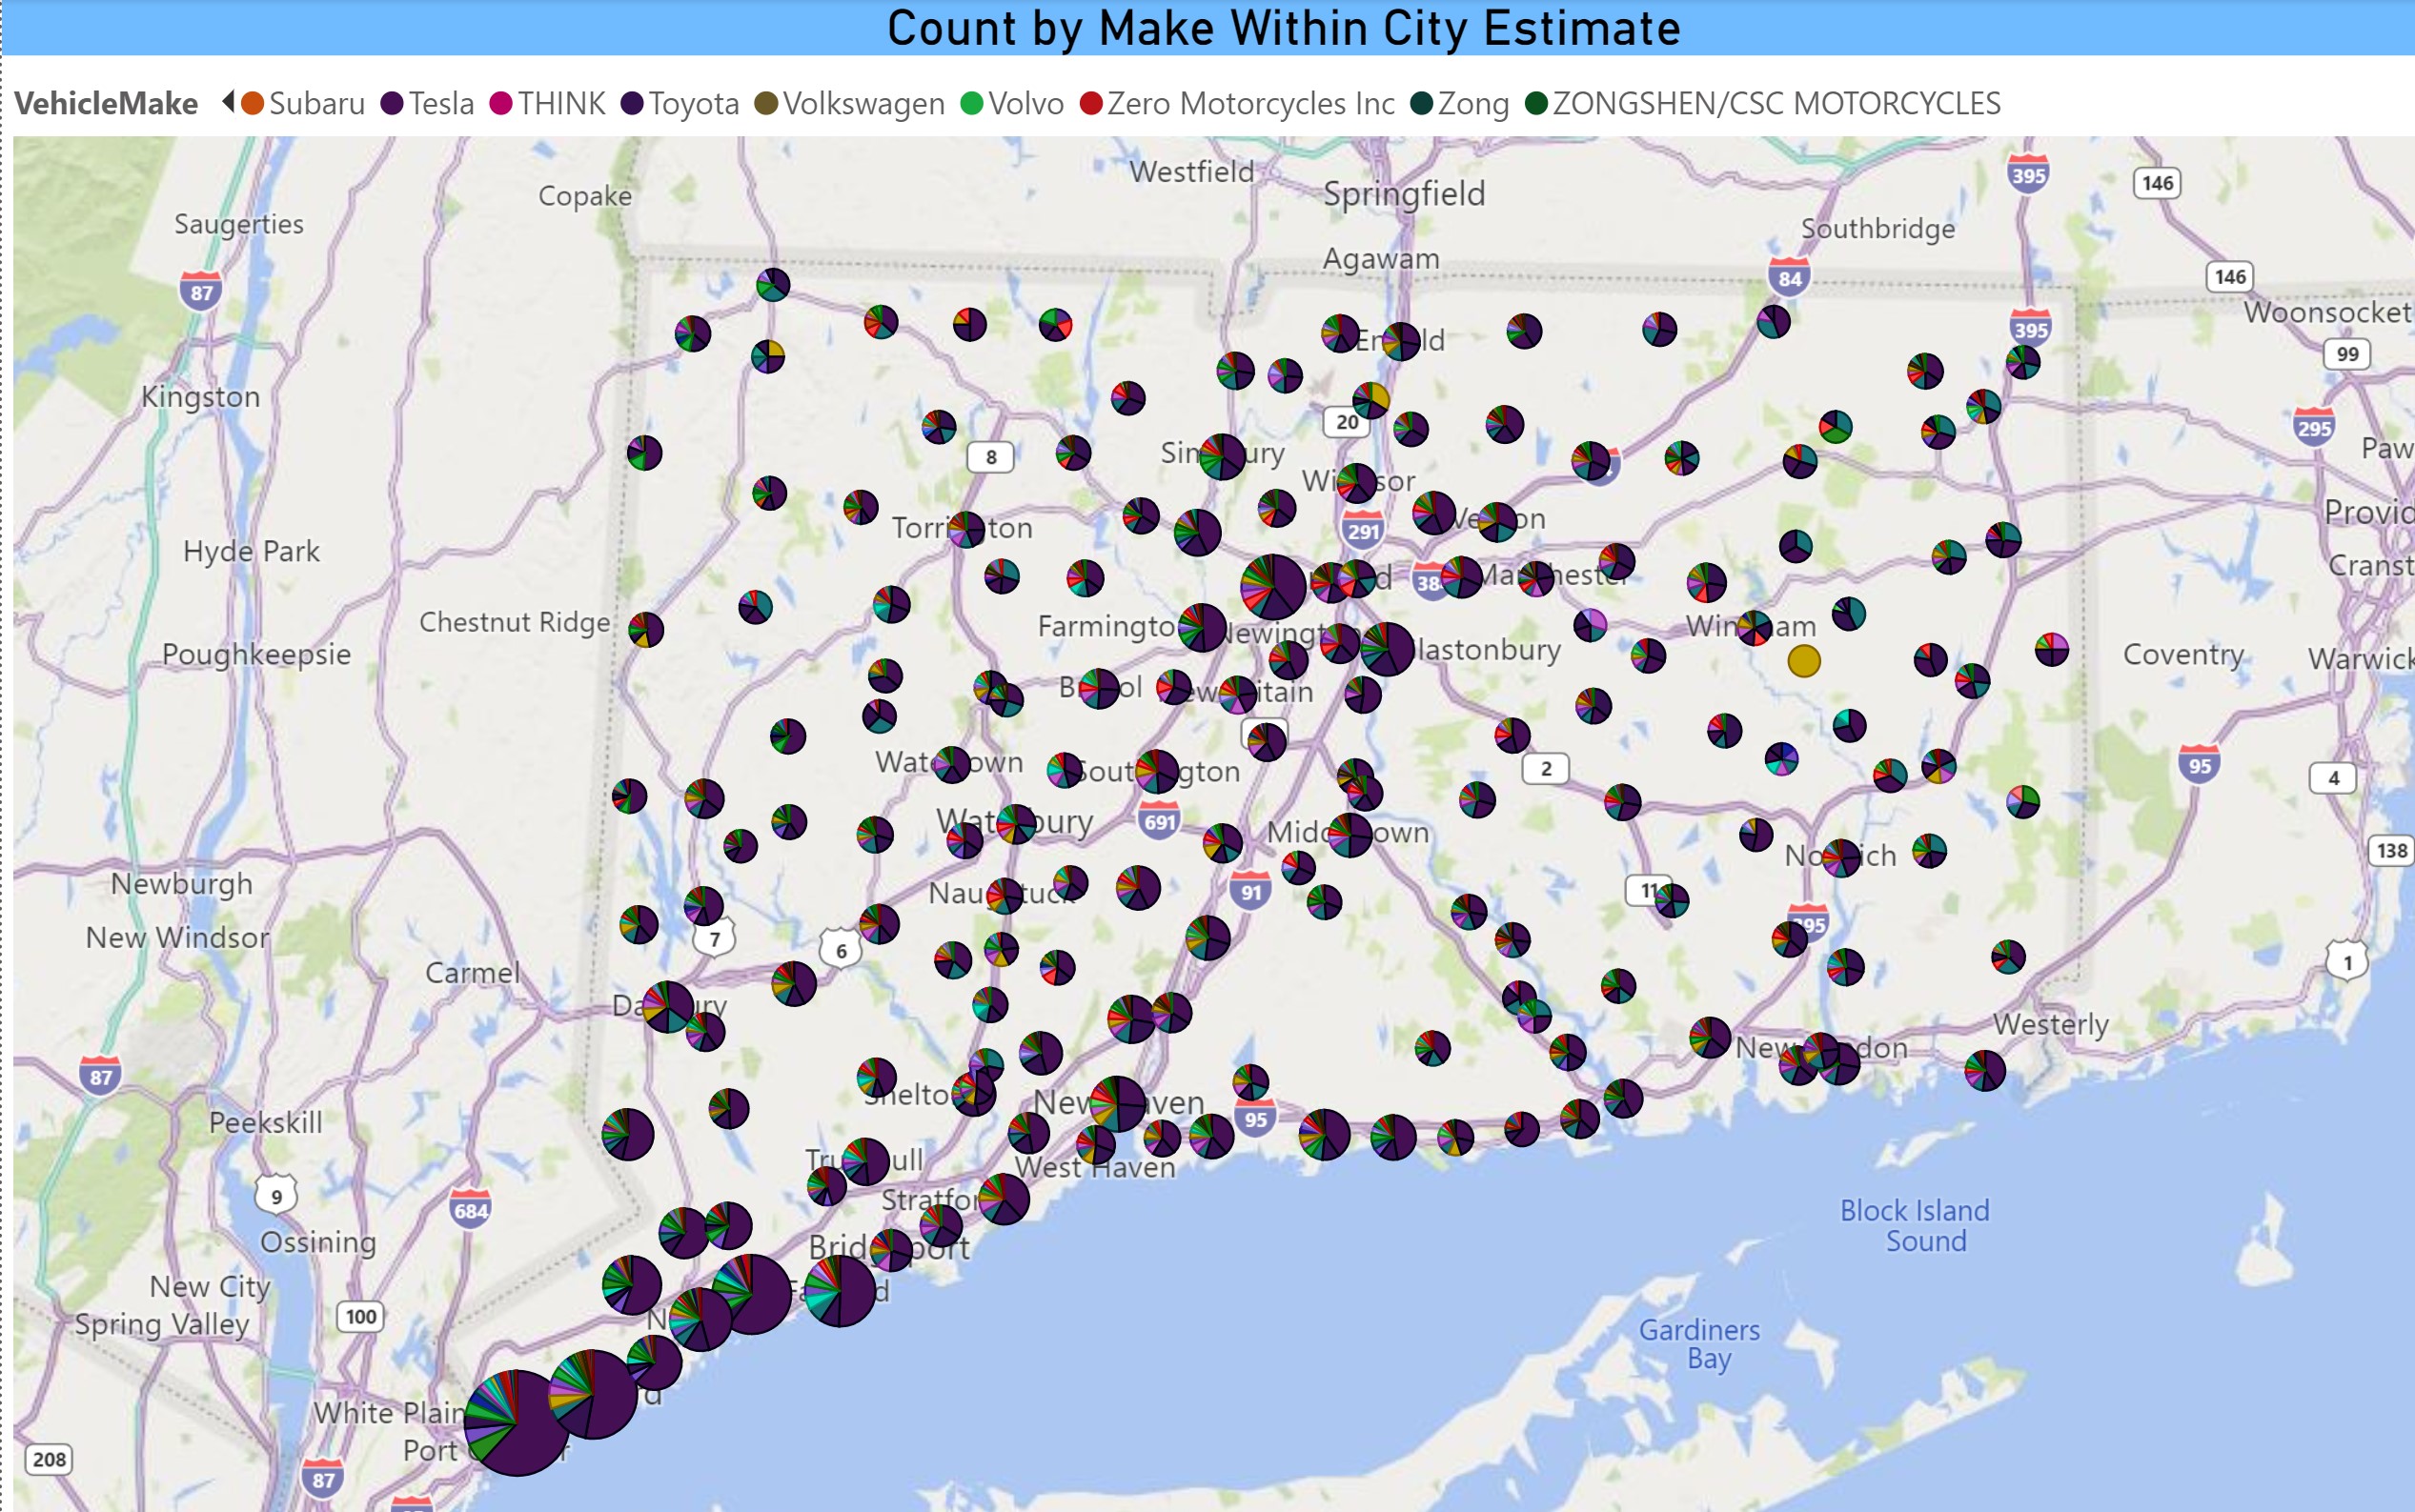
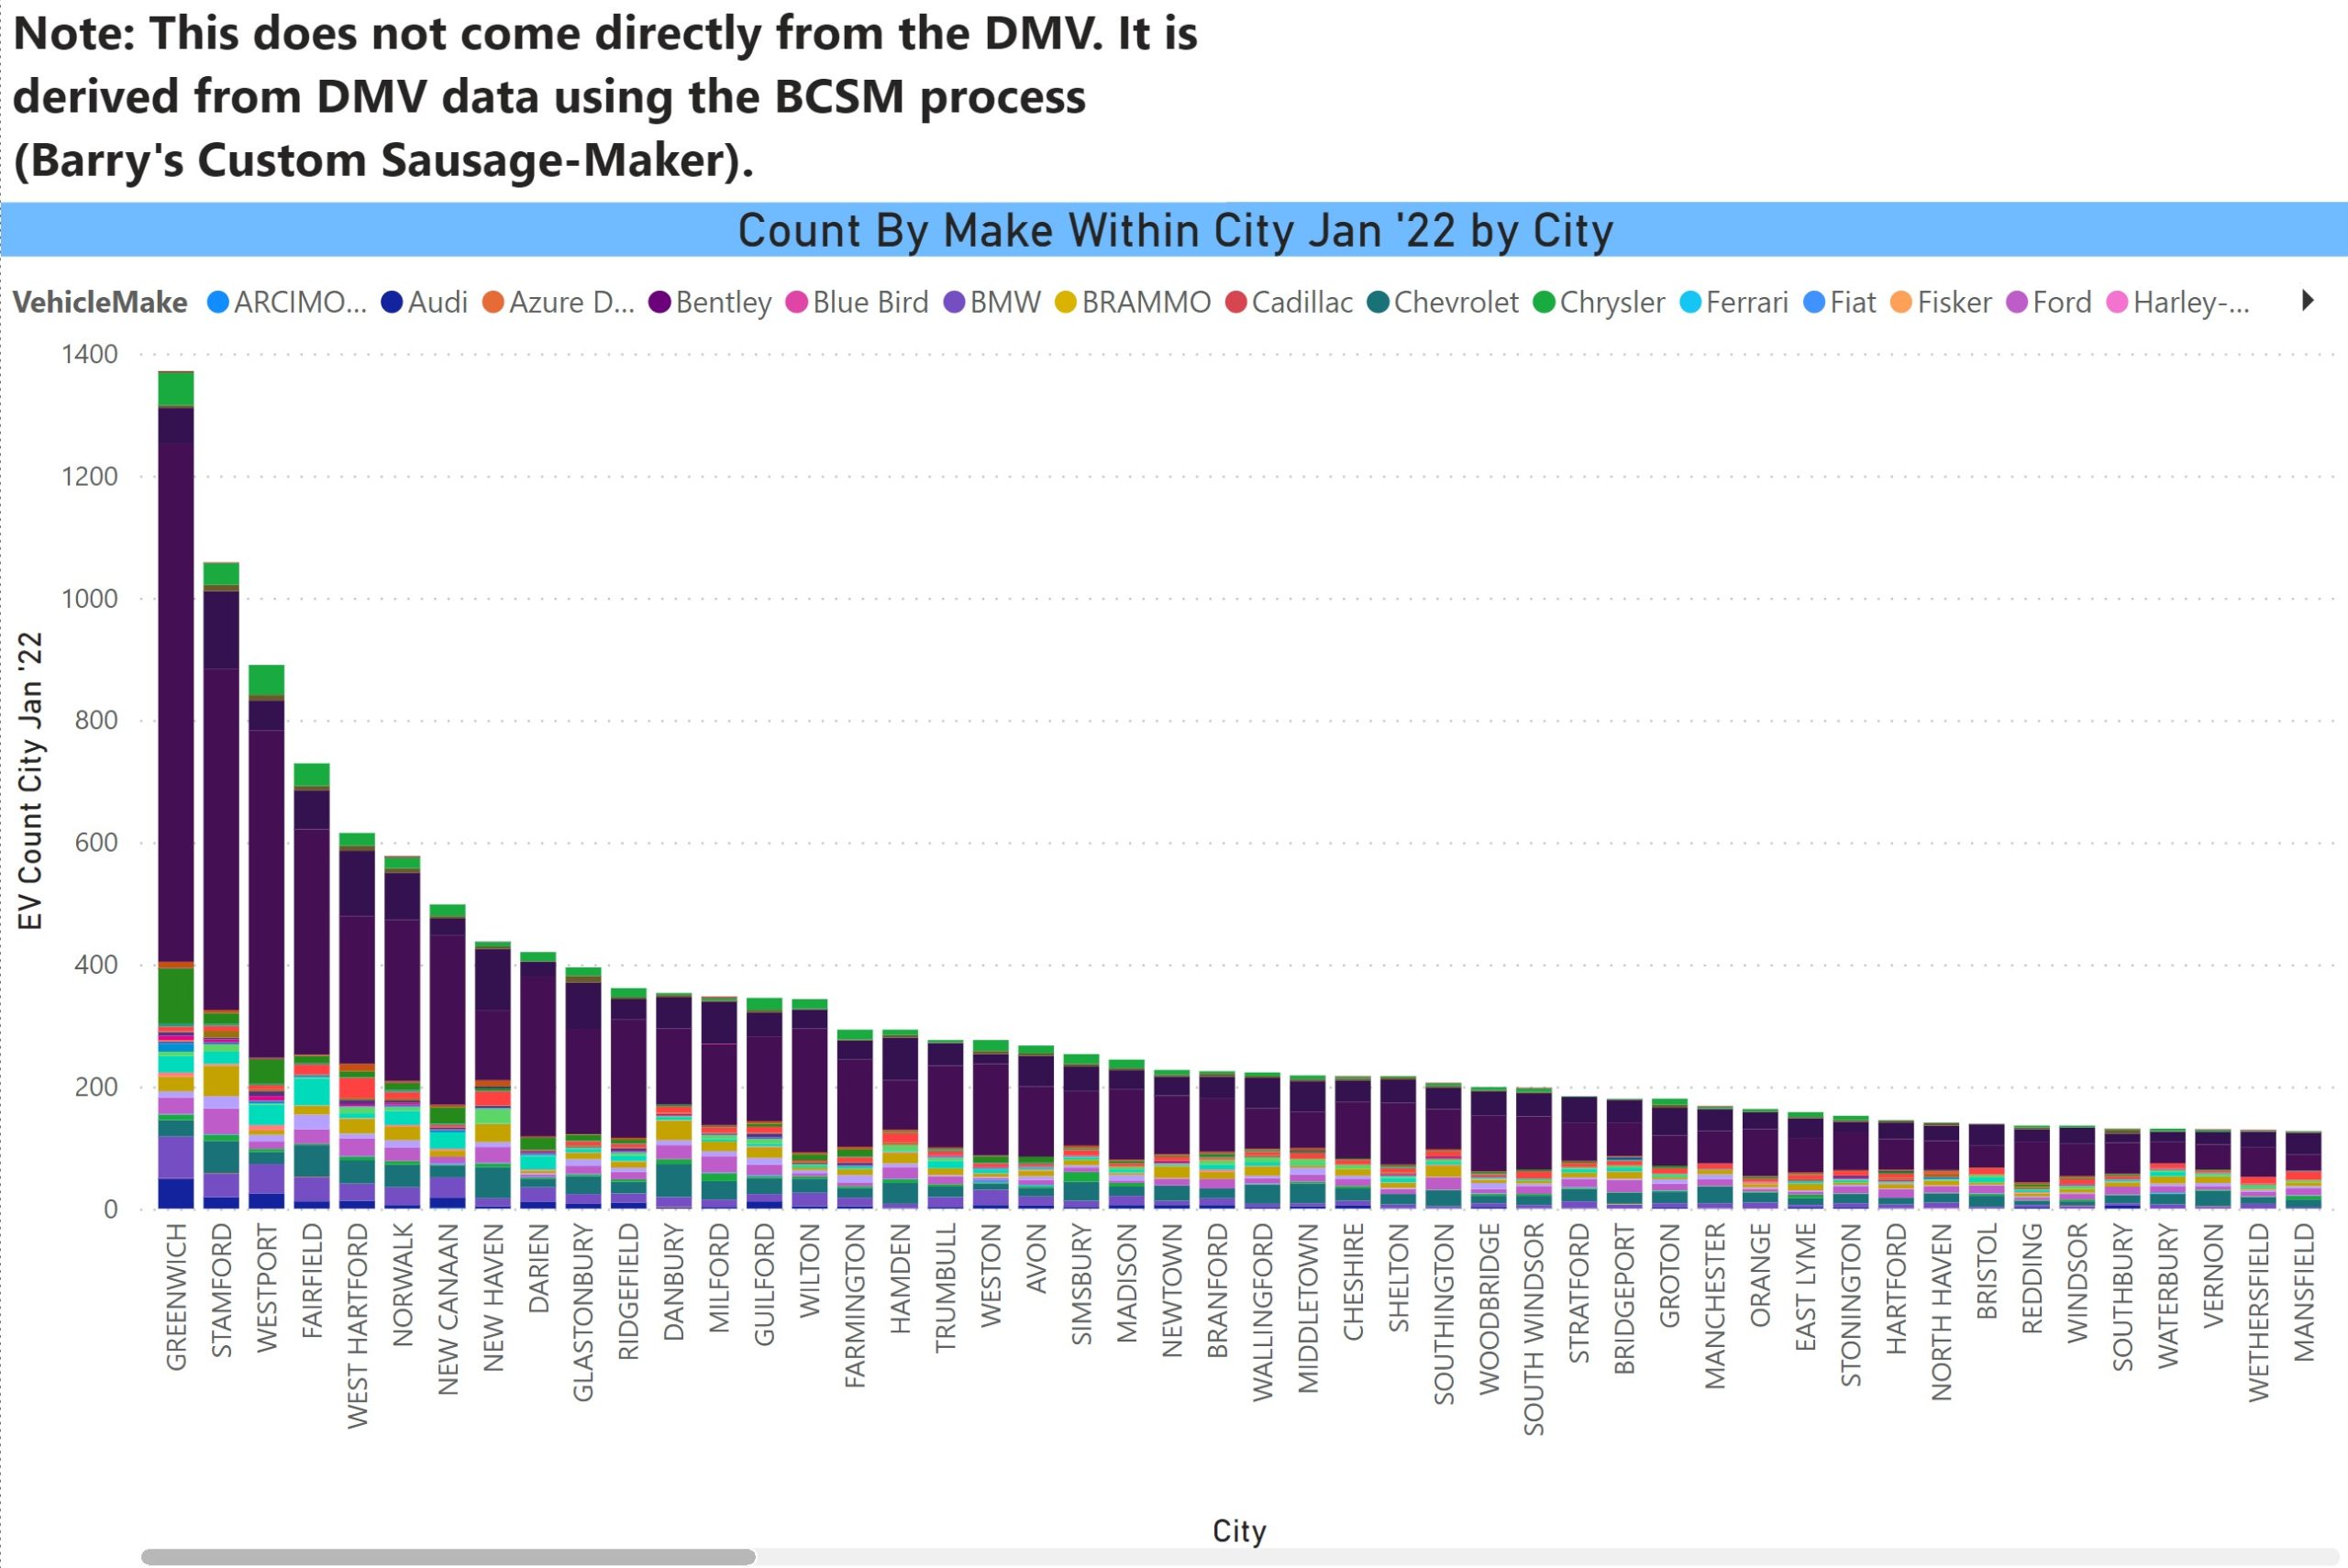
Make Within City
DMV separates the geo from the vehicle data. Their reason is the 14-10 privacy regulations. I think it is a stretch that PII could be deduced from city level data, but the limitation exists, nonetheless. In this chart, I attempt to knit the files together and come up with estimates of EVs by make within city. I need to use the map format to fit every city on a web page. The bar chart displays the cities with the higher EV counts, along with my disclaimer.
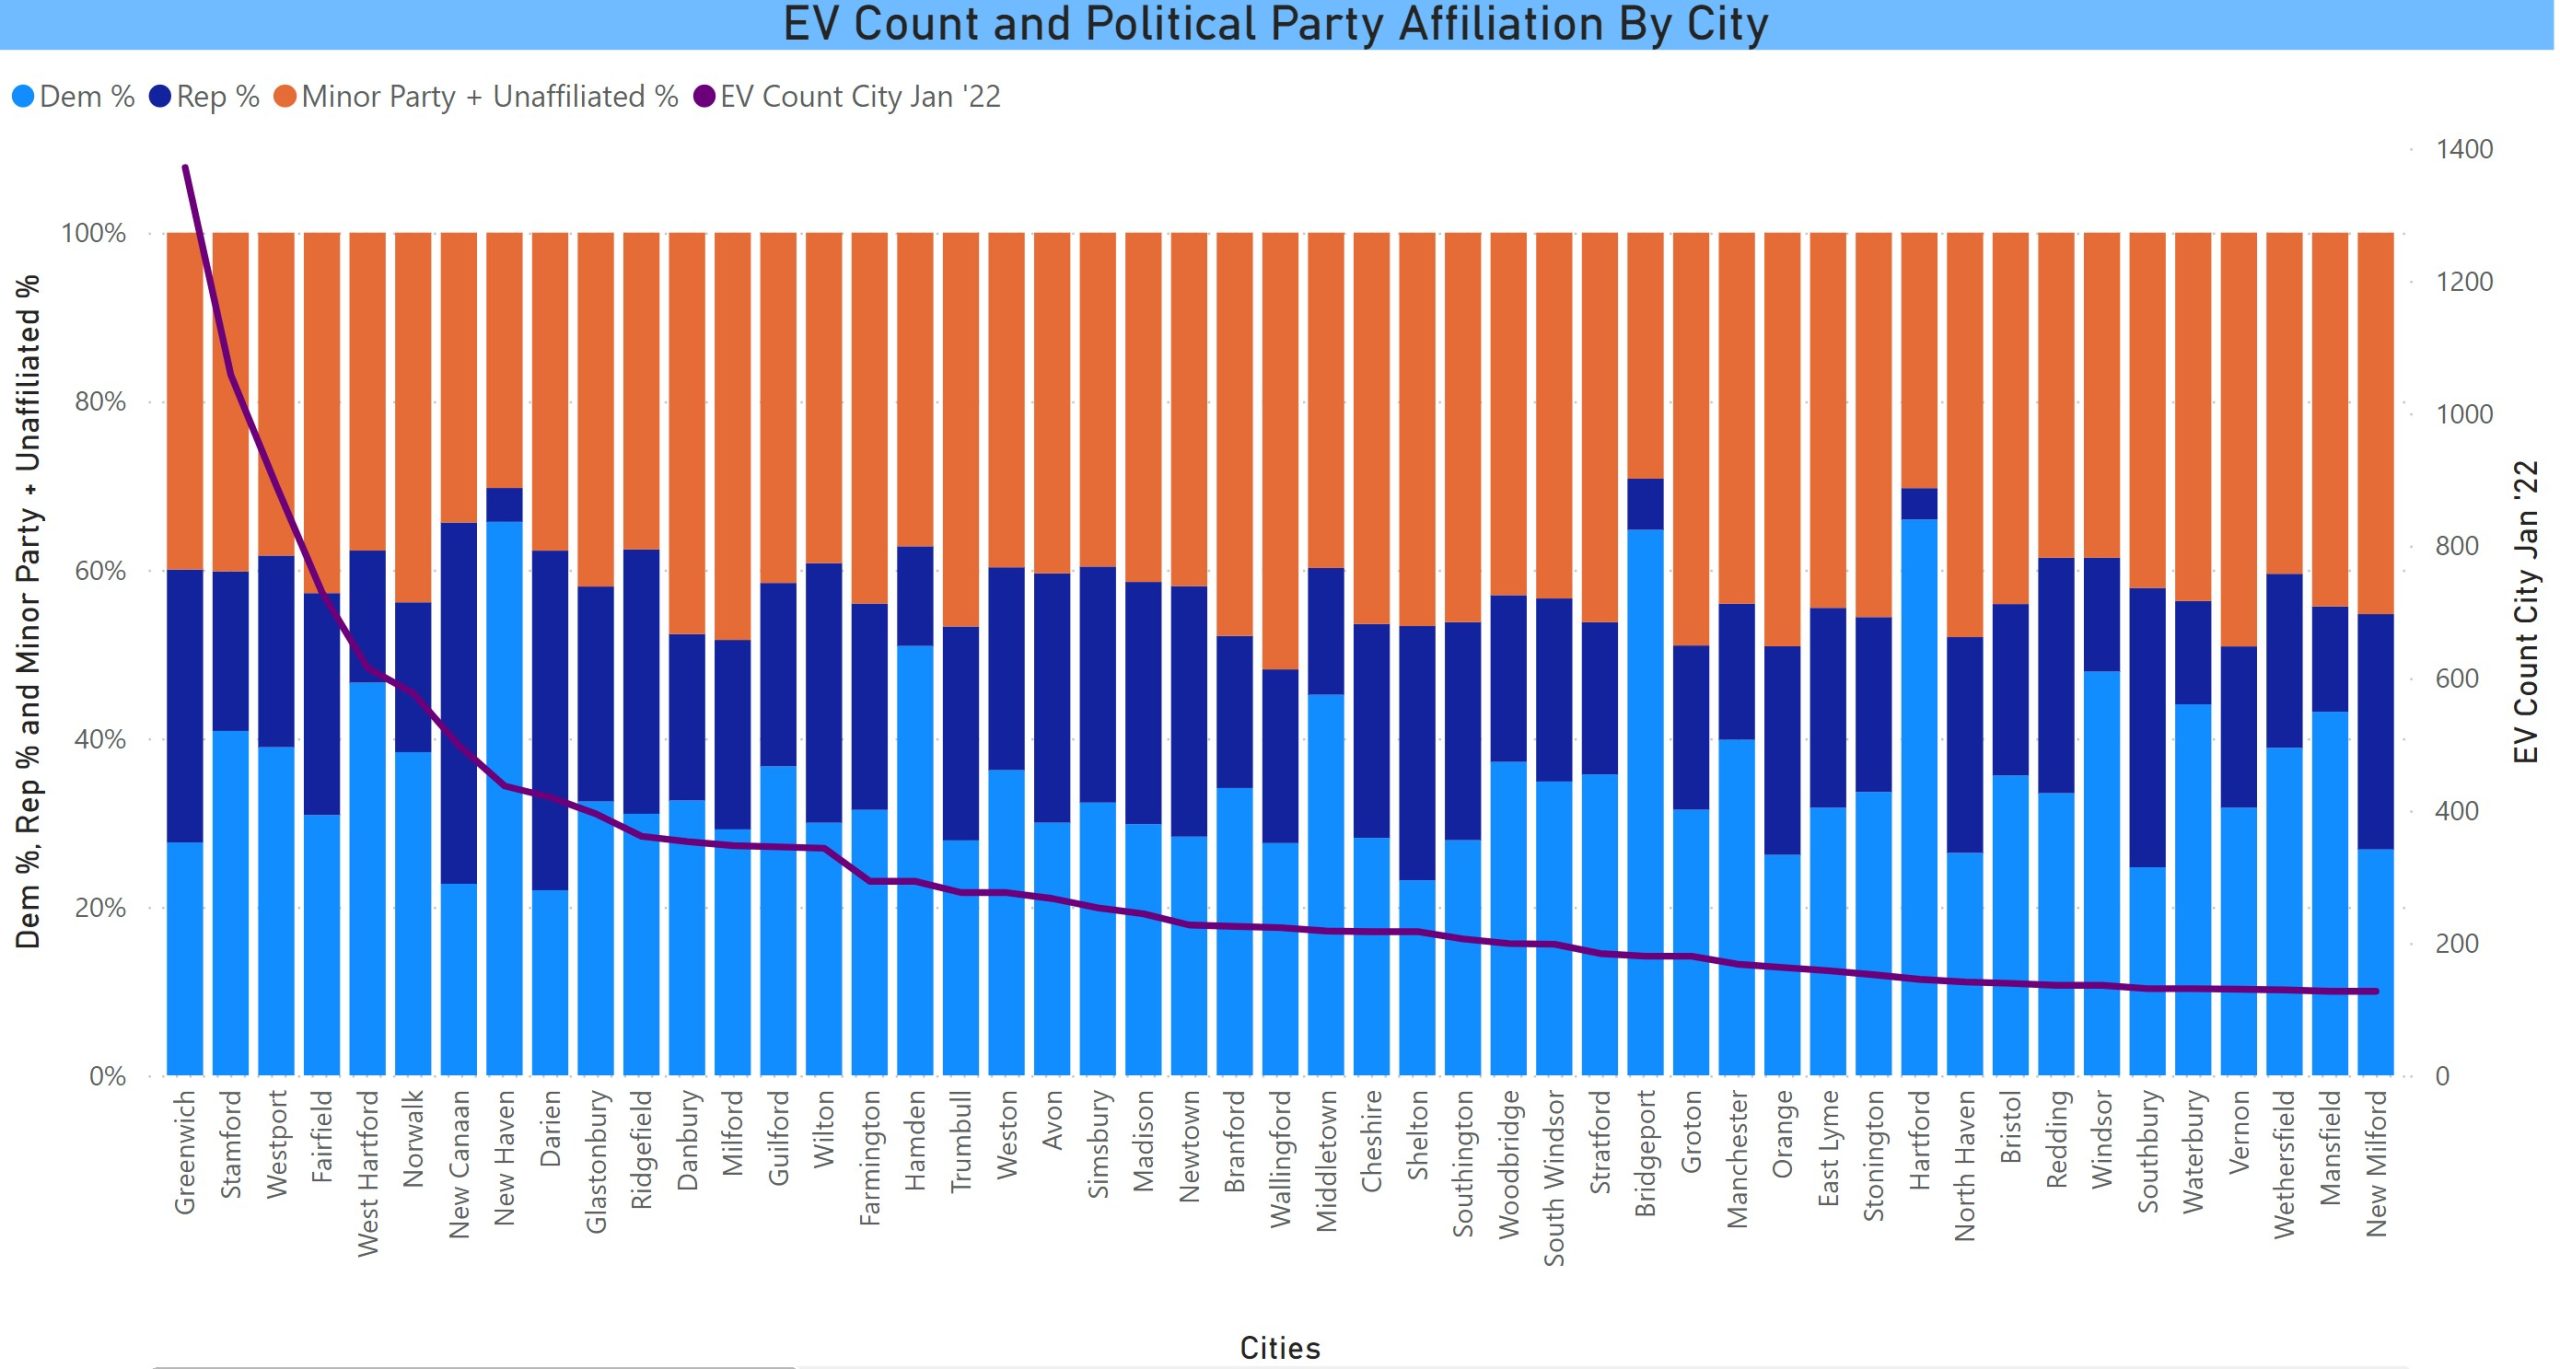
Political Affiliation
This line on this chart is an overlay of EV count by city and the bars are the political affiliations of the voters within each city on a percentage basis (hence, the bars are the same size). There are percentages for Democrats (light blue), Republicans (dark blue), and minor party plus unaffiliated (orange). The minor party plus unaffiliated is mostly the latter. From the looks of this, there does not seem to be a strong correlation of EV ownership with political party, a good thing in our view. This is excerpted due to space limitations.
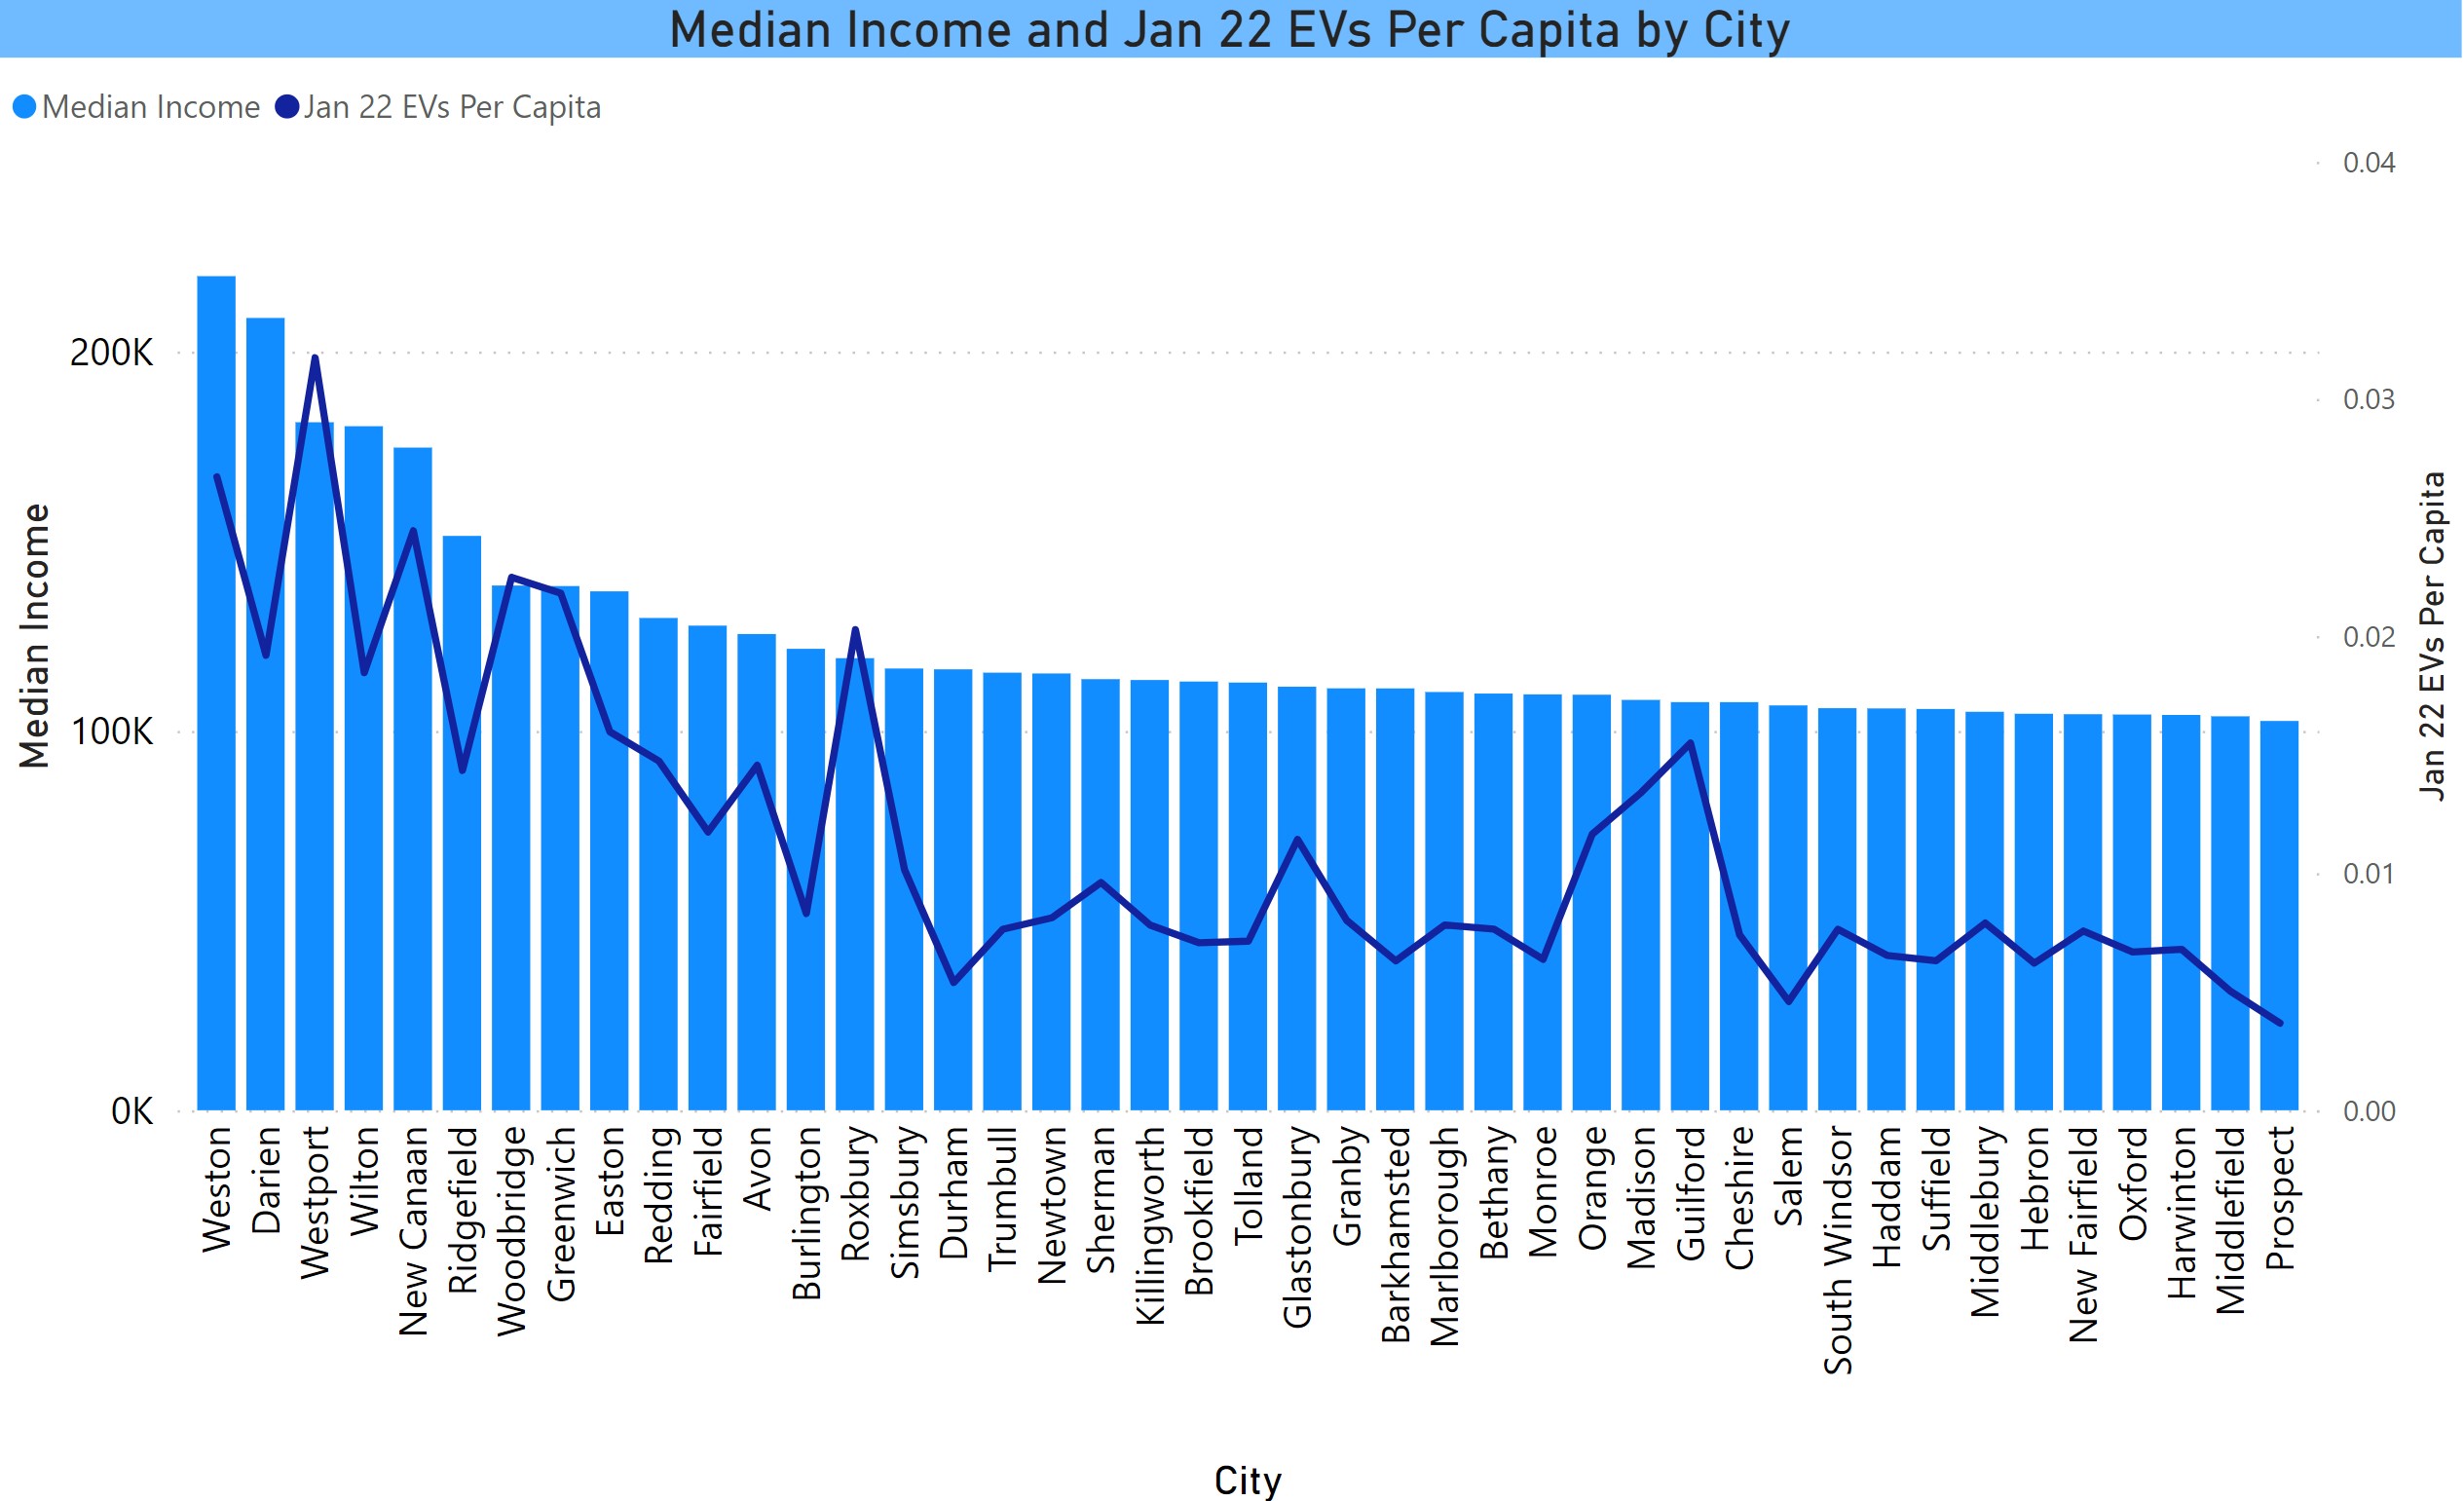
EV Count and Median Income
This shows a much stronger correlation with income. The bars are cities sorted by median income and the line is EVs per capita (to normalize for population variation). This is also an excerpt due to space limitations. The full chart is on the dashboard.
The upper income skew is a challenge that needs to be addressed by manufacturers, EV advocates and policy makers. We want to see affordable EVs for all. Manufacturers need to serve this segment as well as the affluent. Policy makers can help with incentives and, importantly, taking steps to improve access to charging.
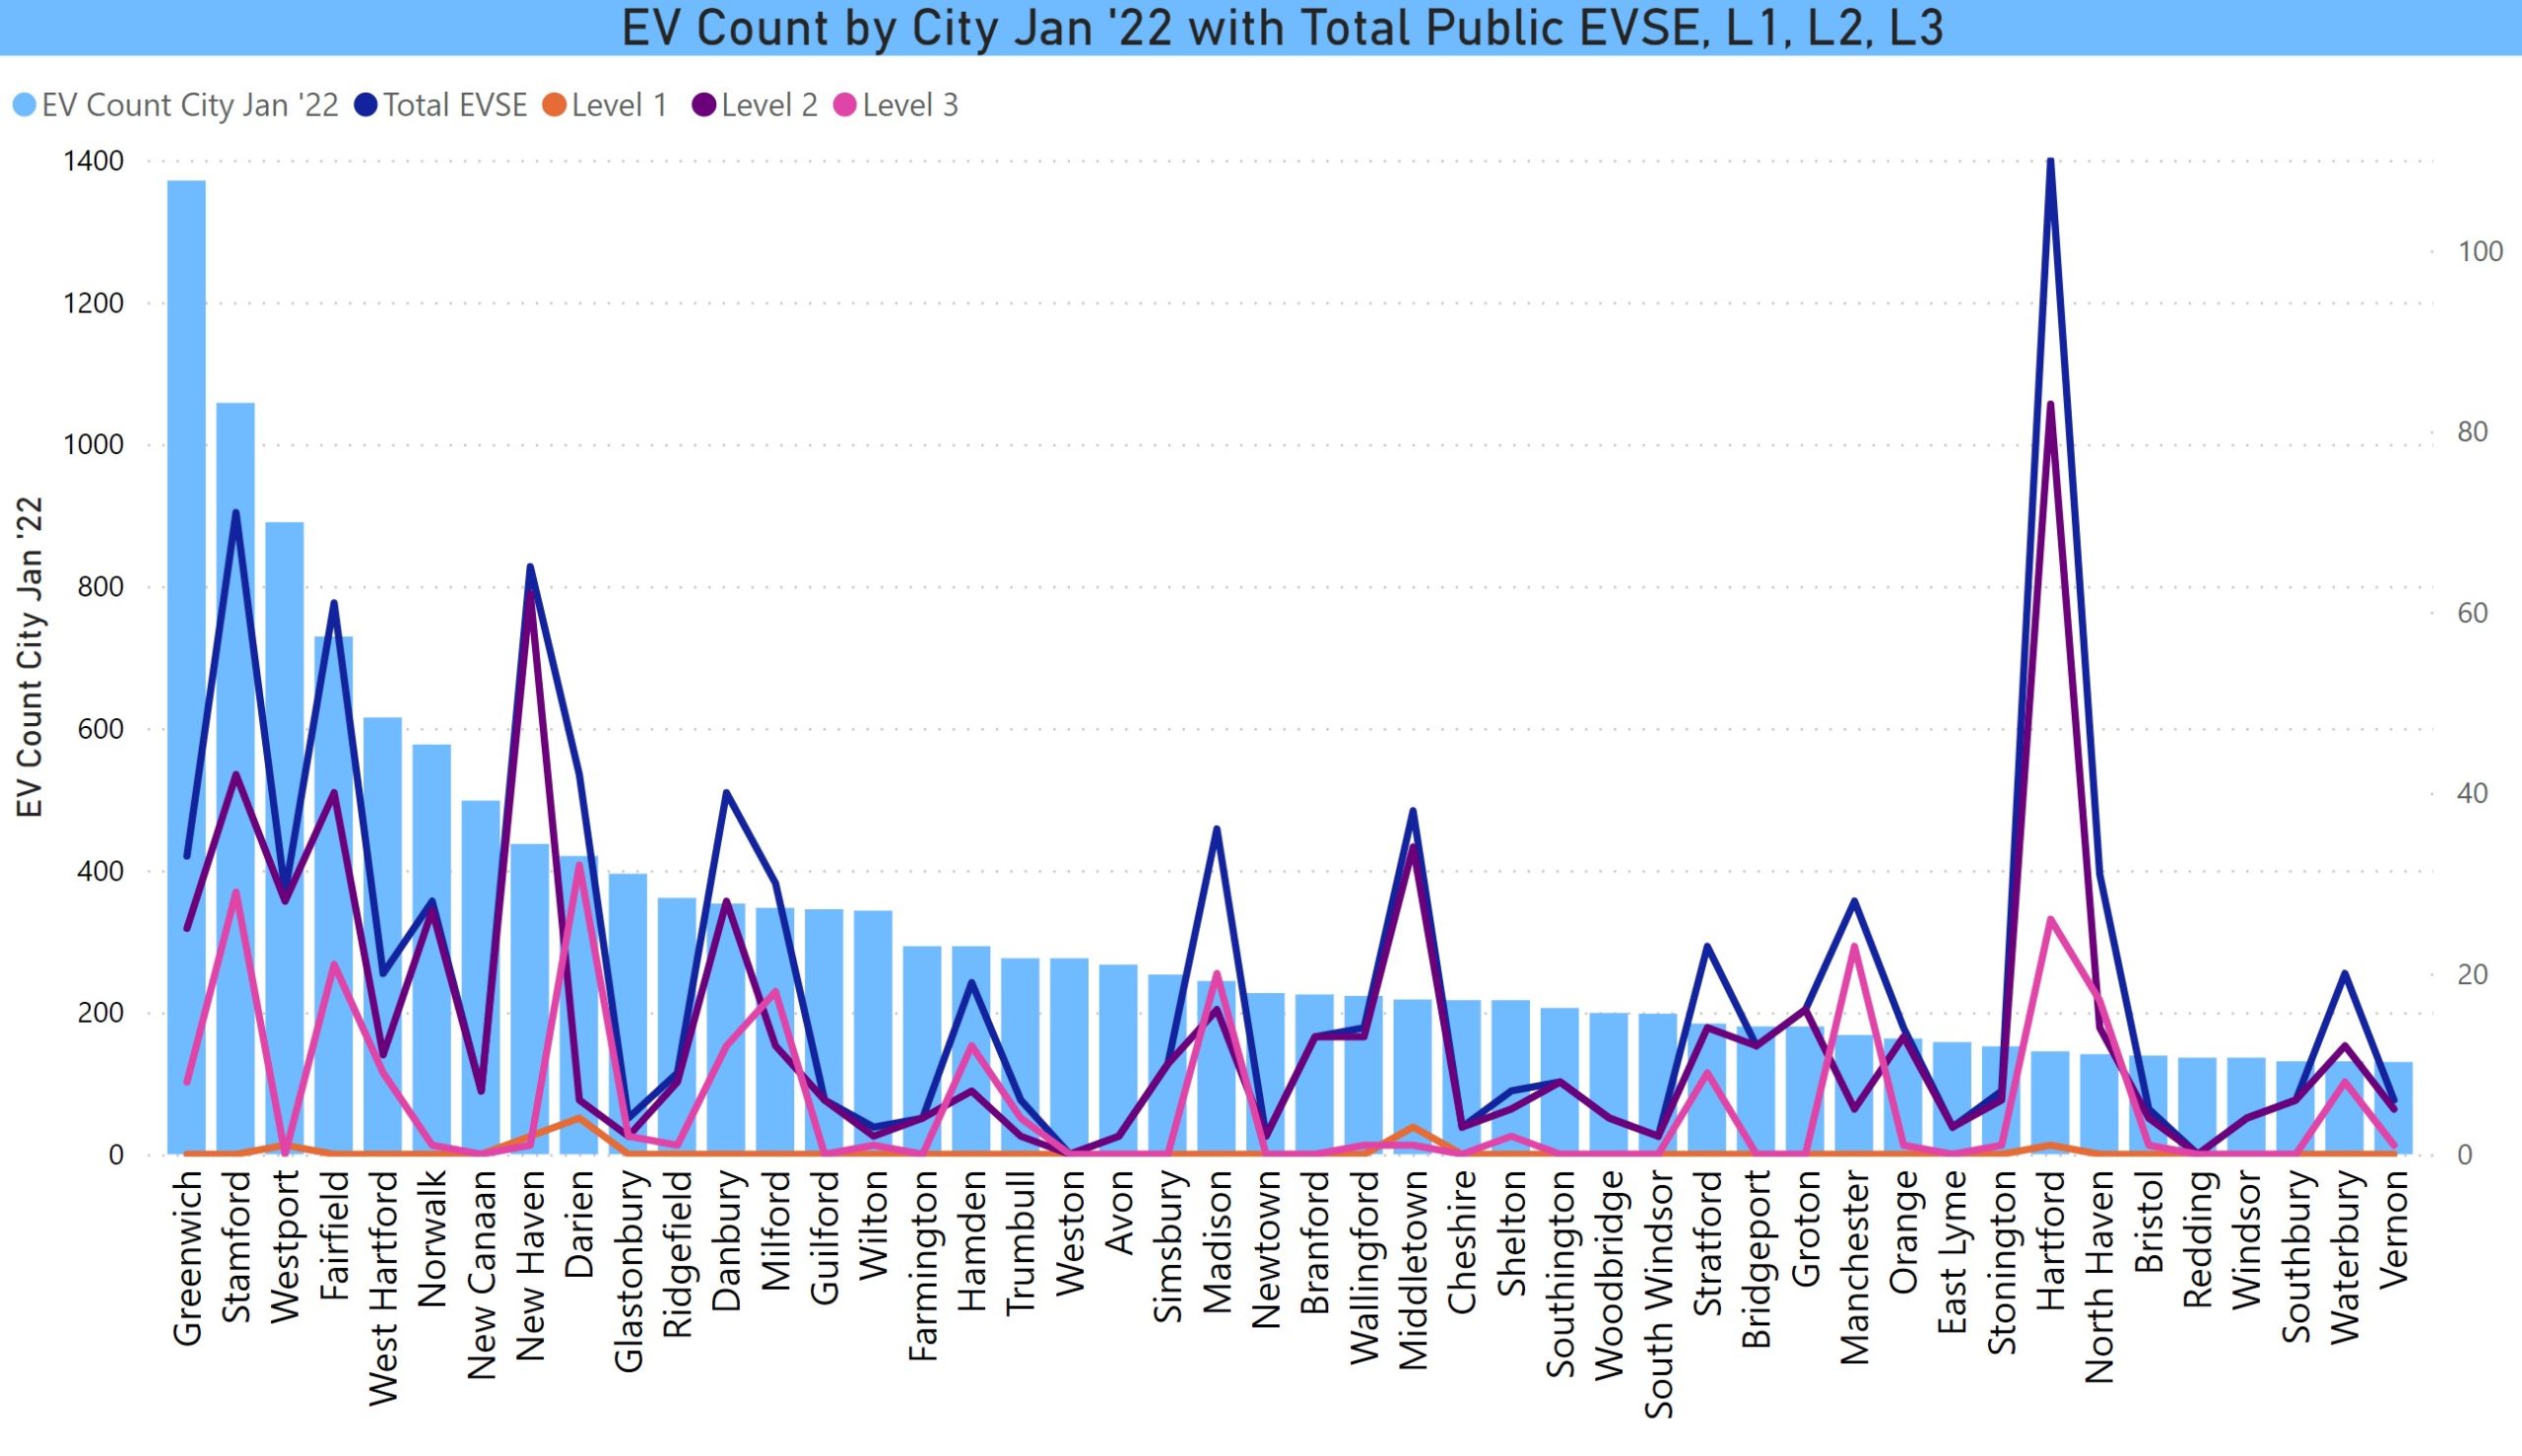
Finally, this is the correlation between EV count by city and public chargers. The line chart displays L1, L2, L3, and the sum of all of them. Again, this is only an excerpt due to space limitations. There is a slider in the dashboard enabling one to display all cities. There is a correlation between EV count and lower numbers of public chargers. To some degree, it is masked in the larger cities where there might be clusters of chargers, L3 in particular, at service areas.