CT Electric Vehicle Registrations Grow 36%

Post by Barry Kresch

17,217 electric vehicles are now registered in Connecticut

This is a topline description of the new dataset. A more in-depth profile will be available when the EV dashboard is updated in a few weeks. The usual disclaimer: This is registrations (not sales). It is cumulative and net and includes new and used vehicles, as well as someone who already owns an EV who moved into the state. On the other hand, vehicles turn over all the time, and these exit the dataset.

The new count of EVs as of July 1 has been released by the Department of Motor Vehicles. The new count of 17,217 represents a 36% increase from the 12,624 one year ago. This is an improvement from the 18% 12-month growth rate we saw in January, but it still falls short of the level of growth needed achieve the 2030 goal of 500,000 electric vehicles set forth in the MultiState Zero Emission Vehicle Action Plan Memorandum of Understanding. There is obviously still a pandemic influence over the growth rate as the economy didn’t begin to recover until the last few months. The growth rate for the past 6 months is 25%. If we were to double that, then we would be roughly on pace with what we need. I will calculate a new required compound annual growth rate and include it in a subsequent post.

One hopeful sign is that the 4335 EVs registered in the first half ot 2021 was about the same as the total for all of 2020, which was 4408. (These may not be completely apples to apples as COVID affected how registrations were handled. I think it still gives a reasonable general picture.)

Fuel Type

The definition of EV in the file includes battery electric vehicles (BEV), Plug-in Hybrid Vehicles (PHEV), Fuel Cell (FCEV), and electric motorcycles (BEMC). Below are the numbers for each.

Electric Vehicles by Fuel Type

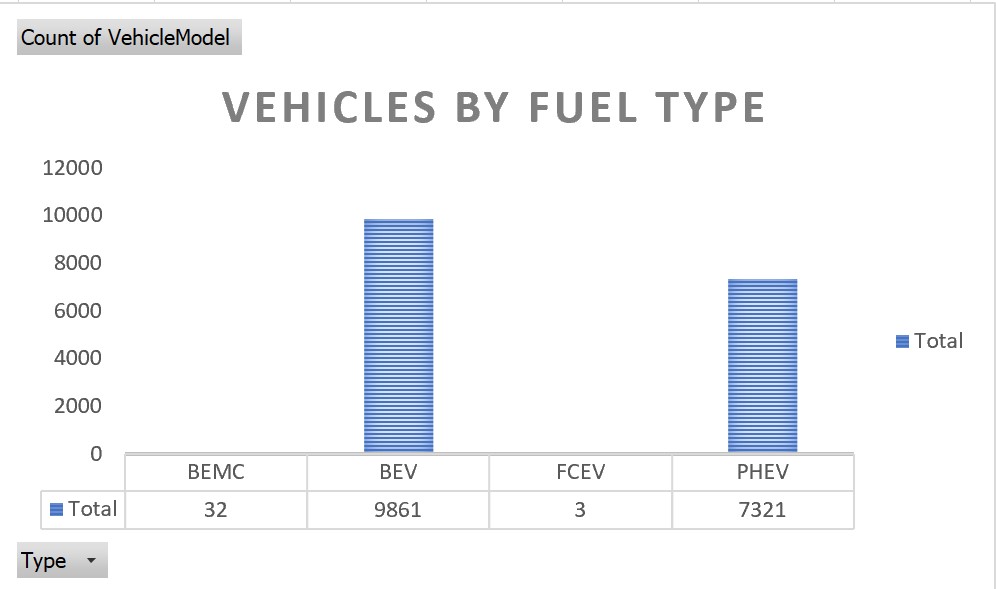
BEVs account for 57% of all EVs. The FCEV count remains where it has been as these are not sold in the state at this time. BEMCs went from 25 to 32.

Top EV Makes

Tesla continues to lead all EV Marques by a mile.

Count of EVs by Top Makes

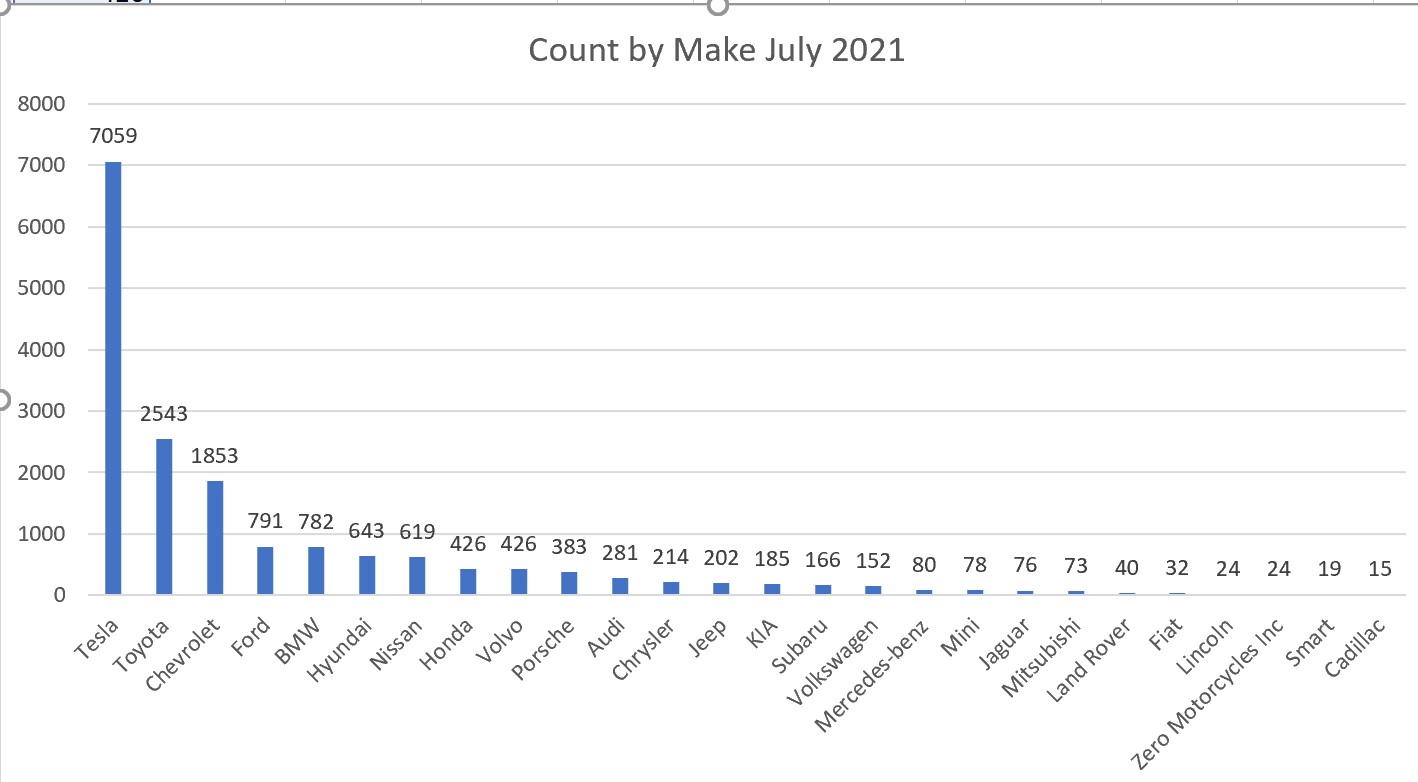
This pattern is consistent with what we have been seeing. There are a small number of makes that account for almost all registered, followed by a long tail. This chart includes any make in double digits, not a very high bar, but there are quite a few below that level. When the dashboard is updated, it will have the full list. The only real change is that Toyota had a nice increase of 33% from January. Toyota saw increased registrations for its Prius Prime models as well as a good start for the RAV4 Prime. Tesla had a 20% increase, obviously off a larger base. Chevrolet reversed its net decline and increased 9%. The net declines were caused by the discontinued Volts gradually declining. This implies an improvement for Bolt sales.

The top make is the Tesla Model 3, which increased 16% since January. The top models are below.

Count of EVs for Top Models

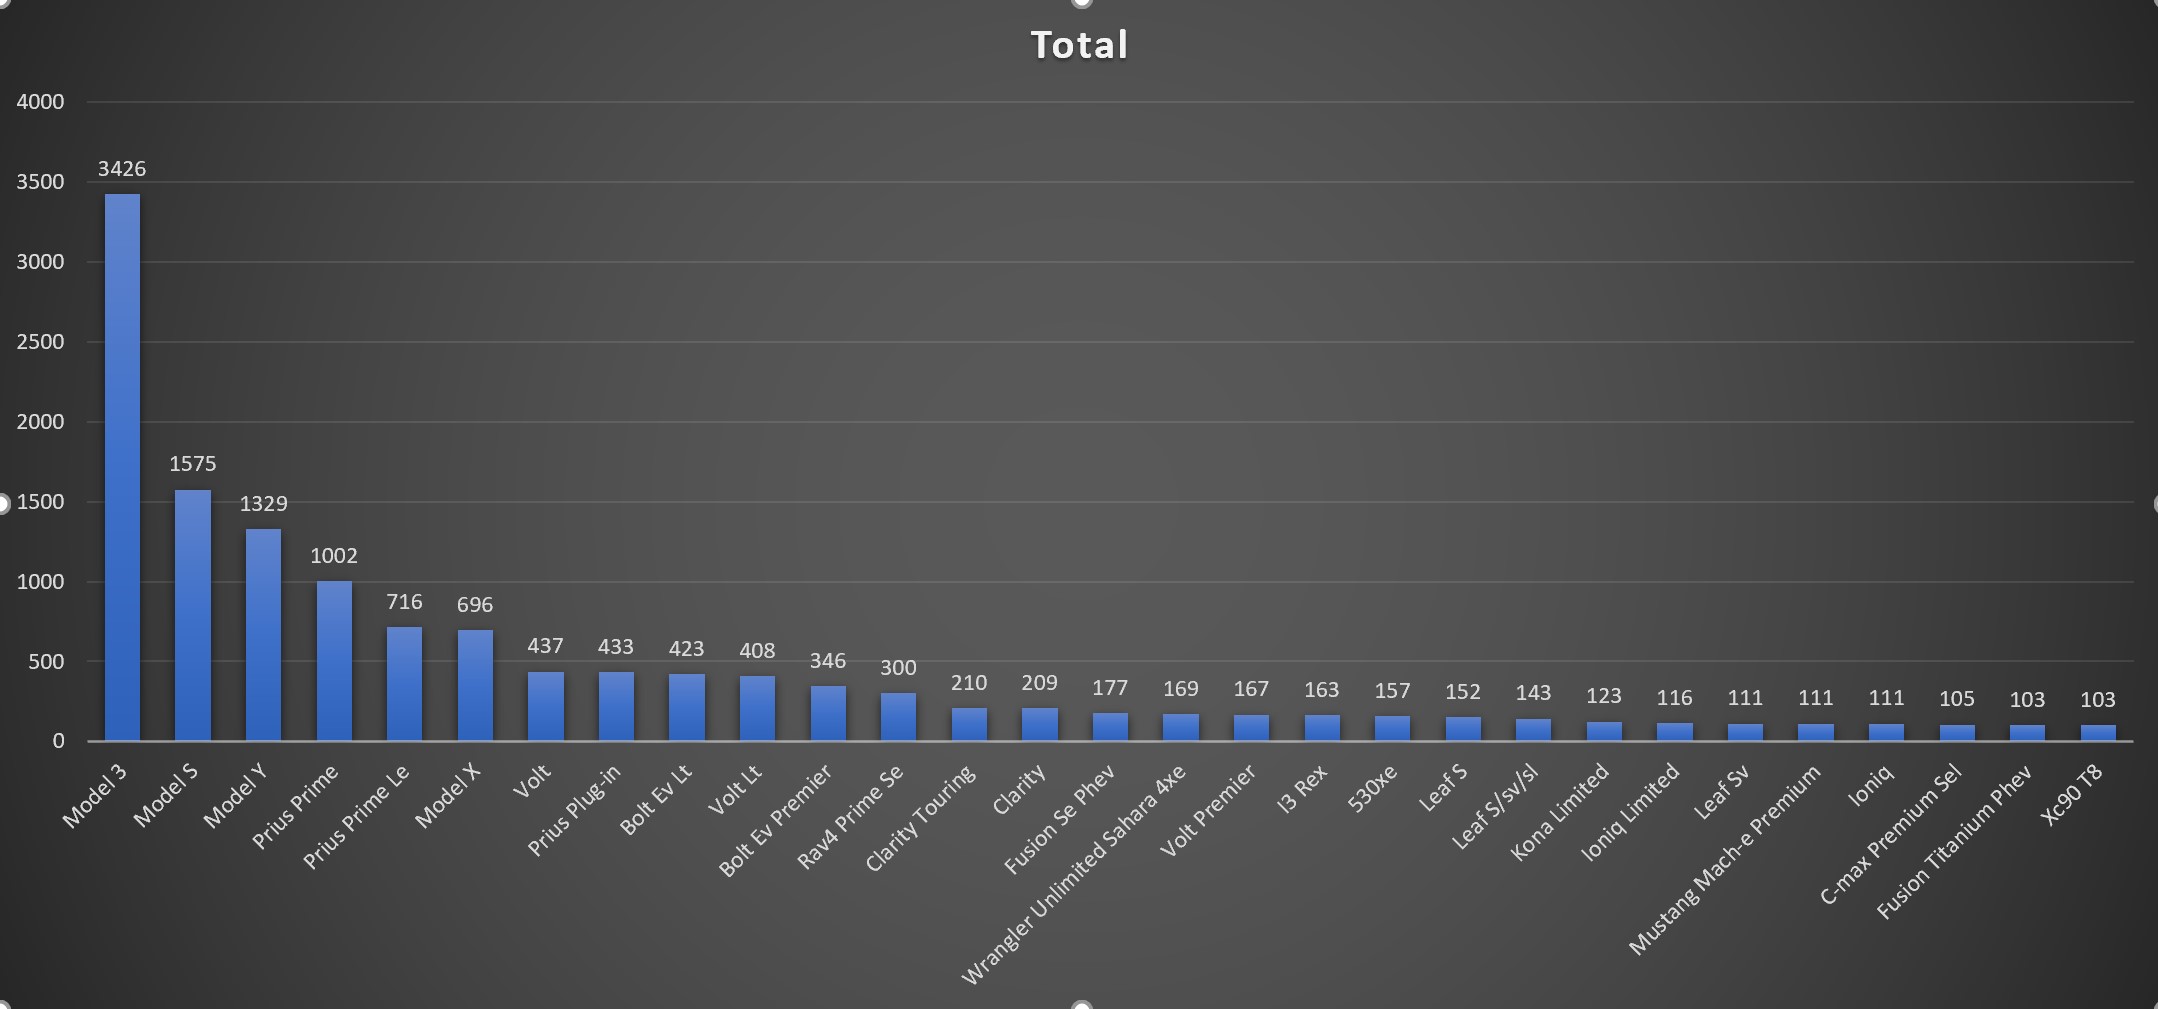
The Model Y has now surpassed the Model X. It increased 101% since January. You will note that some models have multiple names due to different names for different trim levels. This is how the file comes. I will consolidate it for the dashboard as I think that is an easier comparison to make for our purposes. There are 3 Prius variations and they total 2151, making it the second most widely registered EV.

Some New Brands

These is an arbitrary list and counts of some of the newer EVs on the market. In some cases, there are still limited production runs, so it will not be indicative of how successful the vehicle will be.

Audi Q5 Plug-in – 64

BMW X5 Plug-in – 252. This has quickly become the most widely registered BMW EV.

Ford Mustang Mach-E – 136

Jeep Wrangler Plug-in – 202

Polestar 2 – 8

Proterra Electric Buses – 4

VW ID.4 – 57

Volvo Xc40 Recharge – 31


This is What an EV World Could Be

Coronavirus has given us clean air. EVs could, too.

The photo above is from PurpleAir, which is a WiFi-connected, networked, sensor. The date is April 11, 2020. Individuals can buy these and the results are collectively monitored in real-time. Users have the ability to use an app to drill into the data to isolate specific geography. See all those green dots? That never happens in Fairfield County, the part of the state with the worst air pollution. It could, though. This is what an EV world (along with mass transit and bikeways) could be like.

And maybe it will be. An article in Elektrek reports that a study shows consumer intent to purchase EVs is on the rise as a result of this breath of fresh air we have been experiencing. The short-term outlook for EVs is bleak with a recessionary economy and low gas prices, but it would be a silver lining if this served to wake people up to what is possible.

This is a PurpleAir screenshot from 2018. Any value over 25 is, to some degree, unhealthy. Yellow is bad. Orange is very bad.

PurpleAir - Fairfield County air quality, Aug 2018

NASA has also published images, in this case before and after for the Northeast, showing the impact of the coronavirus social distancing measures yielding a 30% decline in nitrogen dioxide. A picture really is worth a thousand words.

NASA air quality images for northeastern US pre and post coronavirus

According to ABC News, a study conducted by Harvard’s T.H. Chan School of Public Health found that “people with COVID-19 who live in areas with high air pollution levels are more likely to die than those who live in less polluted regions.” The study reported that  “a small increase — one microgram per cubic meter — in long-term exposure to particulate matter leads to a 15% increase in the COVID-19 death rate.” They caution that findings are preliminary. It certainly makes intuitive sense.

As reported in the LA Times about a recent clean-air day in California, “If I could wave my magic wand and we all had electric cars tomorrow, I think this is what the air would look like,” said Ronald Cohen, a professor of atmospheric chemistry at UC Berkeley who has been studying the effects of the stay-at-home orders on air quality.

Coronavirus is a high price to pay to experience cleaner air. With the expanded use of EVs, we can keep it that way.


Reducing Our Carbon Footprint

Written by Sarah Donavan

Reducing Carbon Emissions

I am a global warming alarmist, and as such, it would be specious of me not to take action to reduce my carbon footprint.  So . . . I hang my laundry outside (as long as it will get above freezing). I set my thermostat to 65°. My major appliances are set to run on electric off-peak hours, including my whole house fan, which is my only form of air conditioning. Believe it or not, there are immediate benefits to these actions.  My husband’s gym clothes smell wonderful, I keep moving in the winter and I structure my days around a late day swim in the summer.  Additionally, the monetary result of using mostly off-peak power is that we pay less to the utility company! The only carbon reduction resolution that has cramped my style: my rule of thumb not to drive anywhere unless I can accomplish three things.

As my most recent car reaches the end of its viable life (10 years and counting), I am excited to acquire an all-electric car. Since I have always driven Audi, I reserved my all-electric vehicle the night of the Audi e-tron launch party.  While waiting for my new e-tron to arrive, I gave thought to how I was going to charge this car.  What made me decide to install a “solar system” was an article I read in Popular Mechanics that said the fastest payback for solar roof panels was to use the power to charge an electric vehicle.  This is logical to me, as gas is a more expensive source of energy than electricity or heating oil.  The added benefit: charging my car on electrons from the sun will be carbon neutral.

Moving Beyond an EV

We had other objectives as well.  After experiencing 6 powerless days in the wake of Sandy, we wanted an emergency backup system, and we knew that we might not always be home during the day to take advantage of the sun.  We approached Solar City and sized a Power Wall and solar panel system to meet our bare bones needs, both for the house and “generator” (the power walls). The only bummer: we must power the Level Two charger that we installed from the grid, as the power draw will overwhelm the solar and battery system.  But most of our day-to-day electric car charging needs can be addressed with Level One charging, which we can get from the solar cells.

While looking into all these options, we were lucky enough to come across the Electric Vehicle Club, where we are able to compare notes and get up to date information from other club members who are also convinced that electric cars are the way of the future. Many members have their own path toward sustainability, and it is great to hear the new ideas! Many members have had their electric cars for years and it is great to hear that they are still enthusiastic.

We have almost completed installation, and my e-tron is on its way! The Tesla installers were clean, courteous, and professional. I look forward to updating the saga with facts and figures once we get an idea of how the system runs.