July 2023 Dashboard With Full Interactivity
Link to the dashboard.
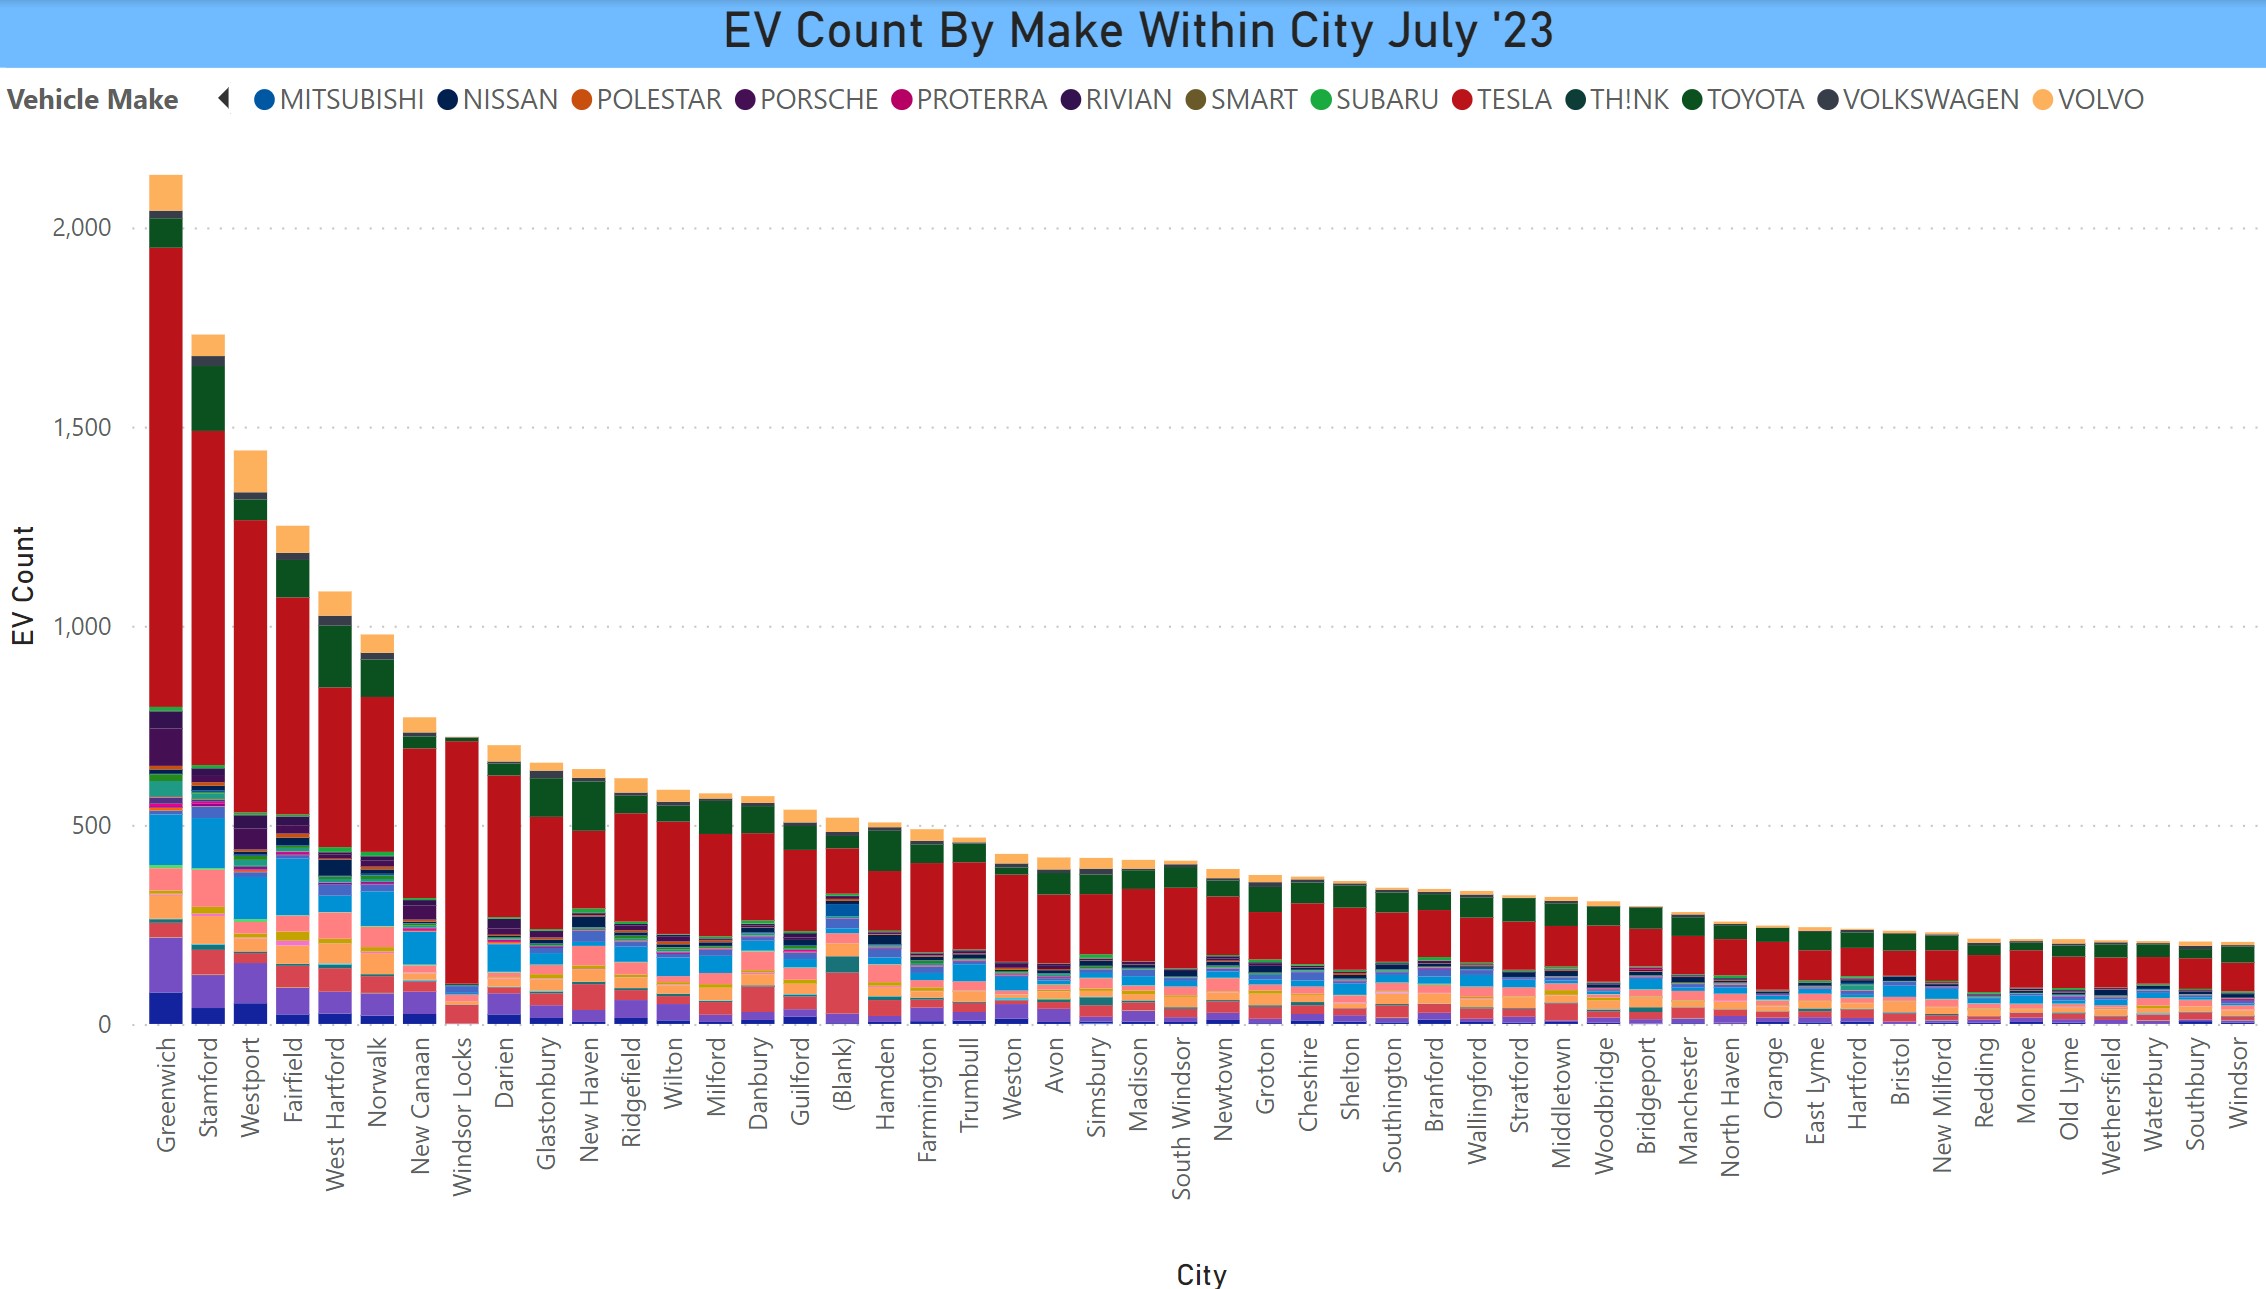
We have published a new dashboard of all EVs registered in CT, updated for the data released as of July 1, 2023. The dashboard has slicers and full interactivity on each page. There are currently 18 pages. More may be added subsequently, Scroll down for pagination and page titles. From the landing page, it is necessary to either click the map image or the “view interactive content” button to spawn the dash.
Included in the dashboard are EVs by make, model, city, county, per capita, % of all vehicles and some trending. Trends only go back to January 2022. As always, we have to live within the limitations imposed by the files available to us. There are just too many differences between this file and the older ones to easily integrate them.
This file contained a total of 35,883 registered EVs, which is a bit lower than the 36,269 noted on the DEEP EV page. Some of the difference can be explained by the dashboard file containing only BEVs and PHEVs, whereas the DEEP data include 61 electric motorcycles and 3 fuel cell vehicles. The other 322 are MIA. Also, there were ~500 records with blank geo fields, so the sum of the cities is less than the total.
Net Registrations
Keep in mind, the data are net registrations. Net registrations include:
- Existing vehicles
- New vehicles
- Newly registered used vehicles
- People who own EVs moving into the state
Minus:
- People getting rid of their vehicle
- EV owners leaving the state
This data point is up 42% from one year ago, which is not bad, but at minimum needs to be consistently maintained if the state is to reach its EV objectives.
There are also some pages with newly registered vehicles, that is vehicles registered in the first half of this year. This enables the ability to see emerging trends such as the increasing BEV market share and which brands are gaining traction.
Interactivity
Clicking on a chart element on a page will cross filter with any other charts on the same page. This doesn’t happen too often as the charts get too small when presented in this format. Most pages have slicers (check boxes). Checking a box will filter the data. To check multiple boxes, depress the command key (Mac) or Ctrl key (PC).
Please reach out to the EV Club if you would like help using the data.