Geographic Profile – Counties and Cities July 2022
All data are from a Freedom of Information Act Request filed with the Department of Motor Vehicles for EV registration data as of July 1. Due to space constraints, many of the screen captures below do not show the full chart. All of the data is published to the website on the Interactive EV Dashboard. Complete charts are there, including slicers and sliders.
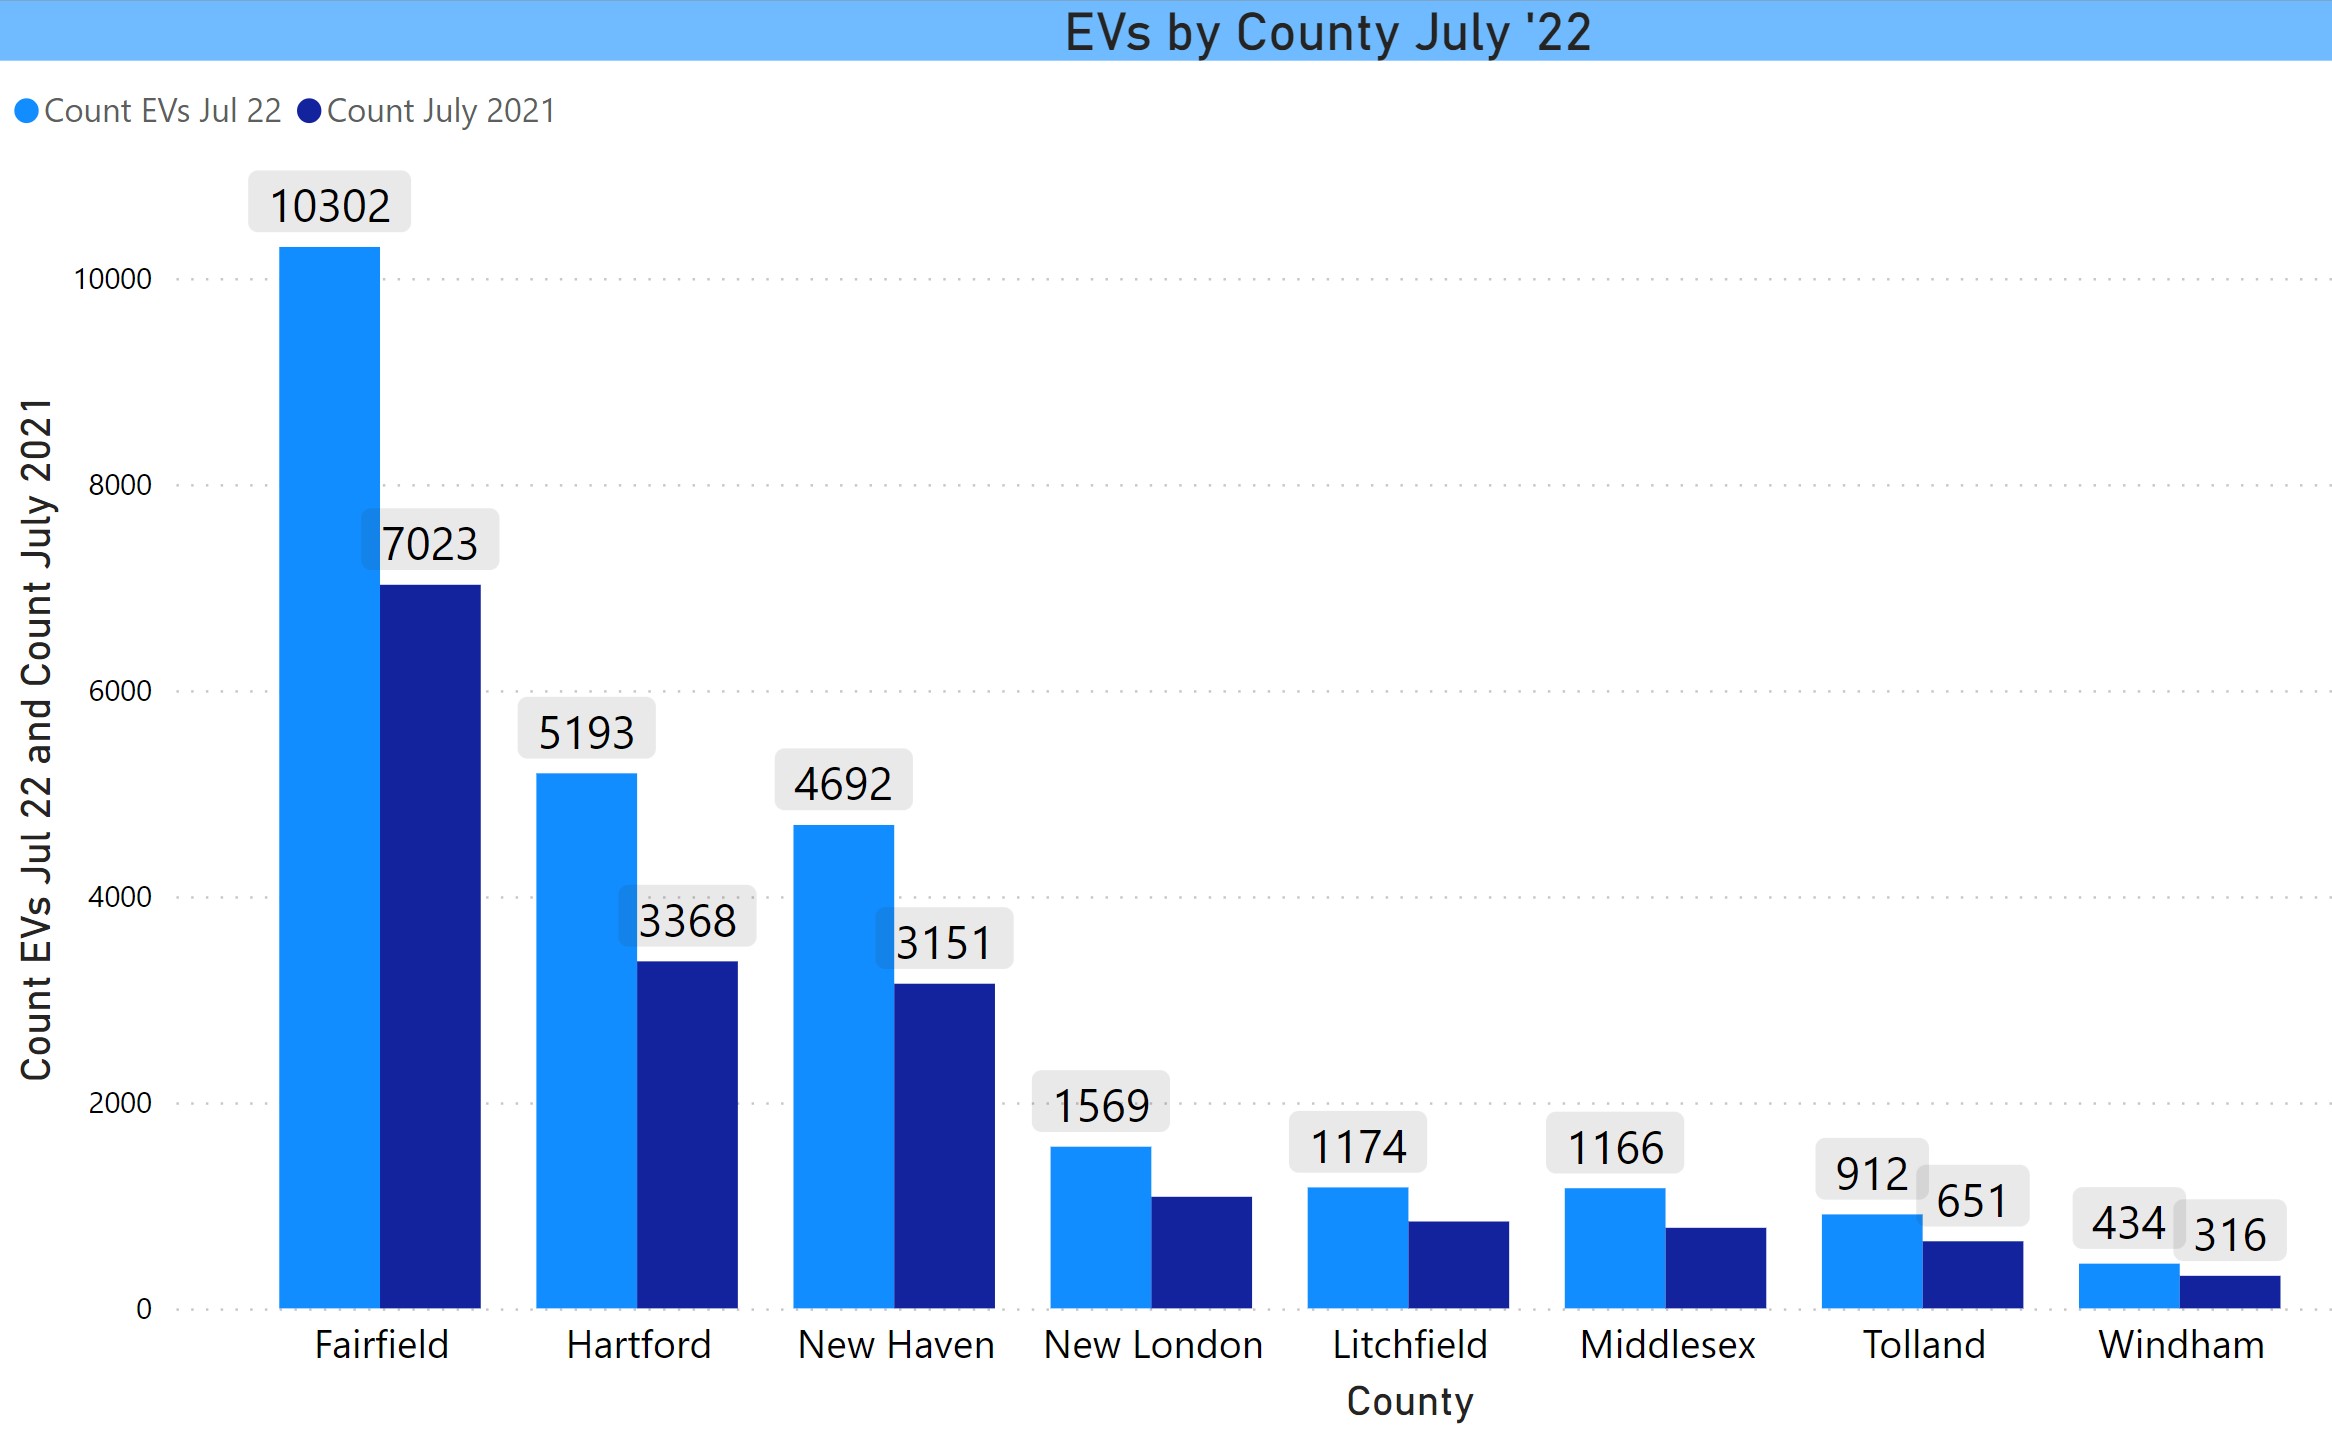
This chart shows year over year growth in EVs by County (July 2022/July 2021). Fairfield County continues to account for about 40% of the EVs registered in the state.
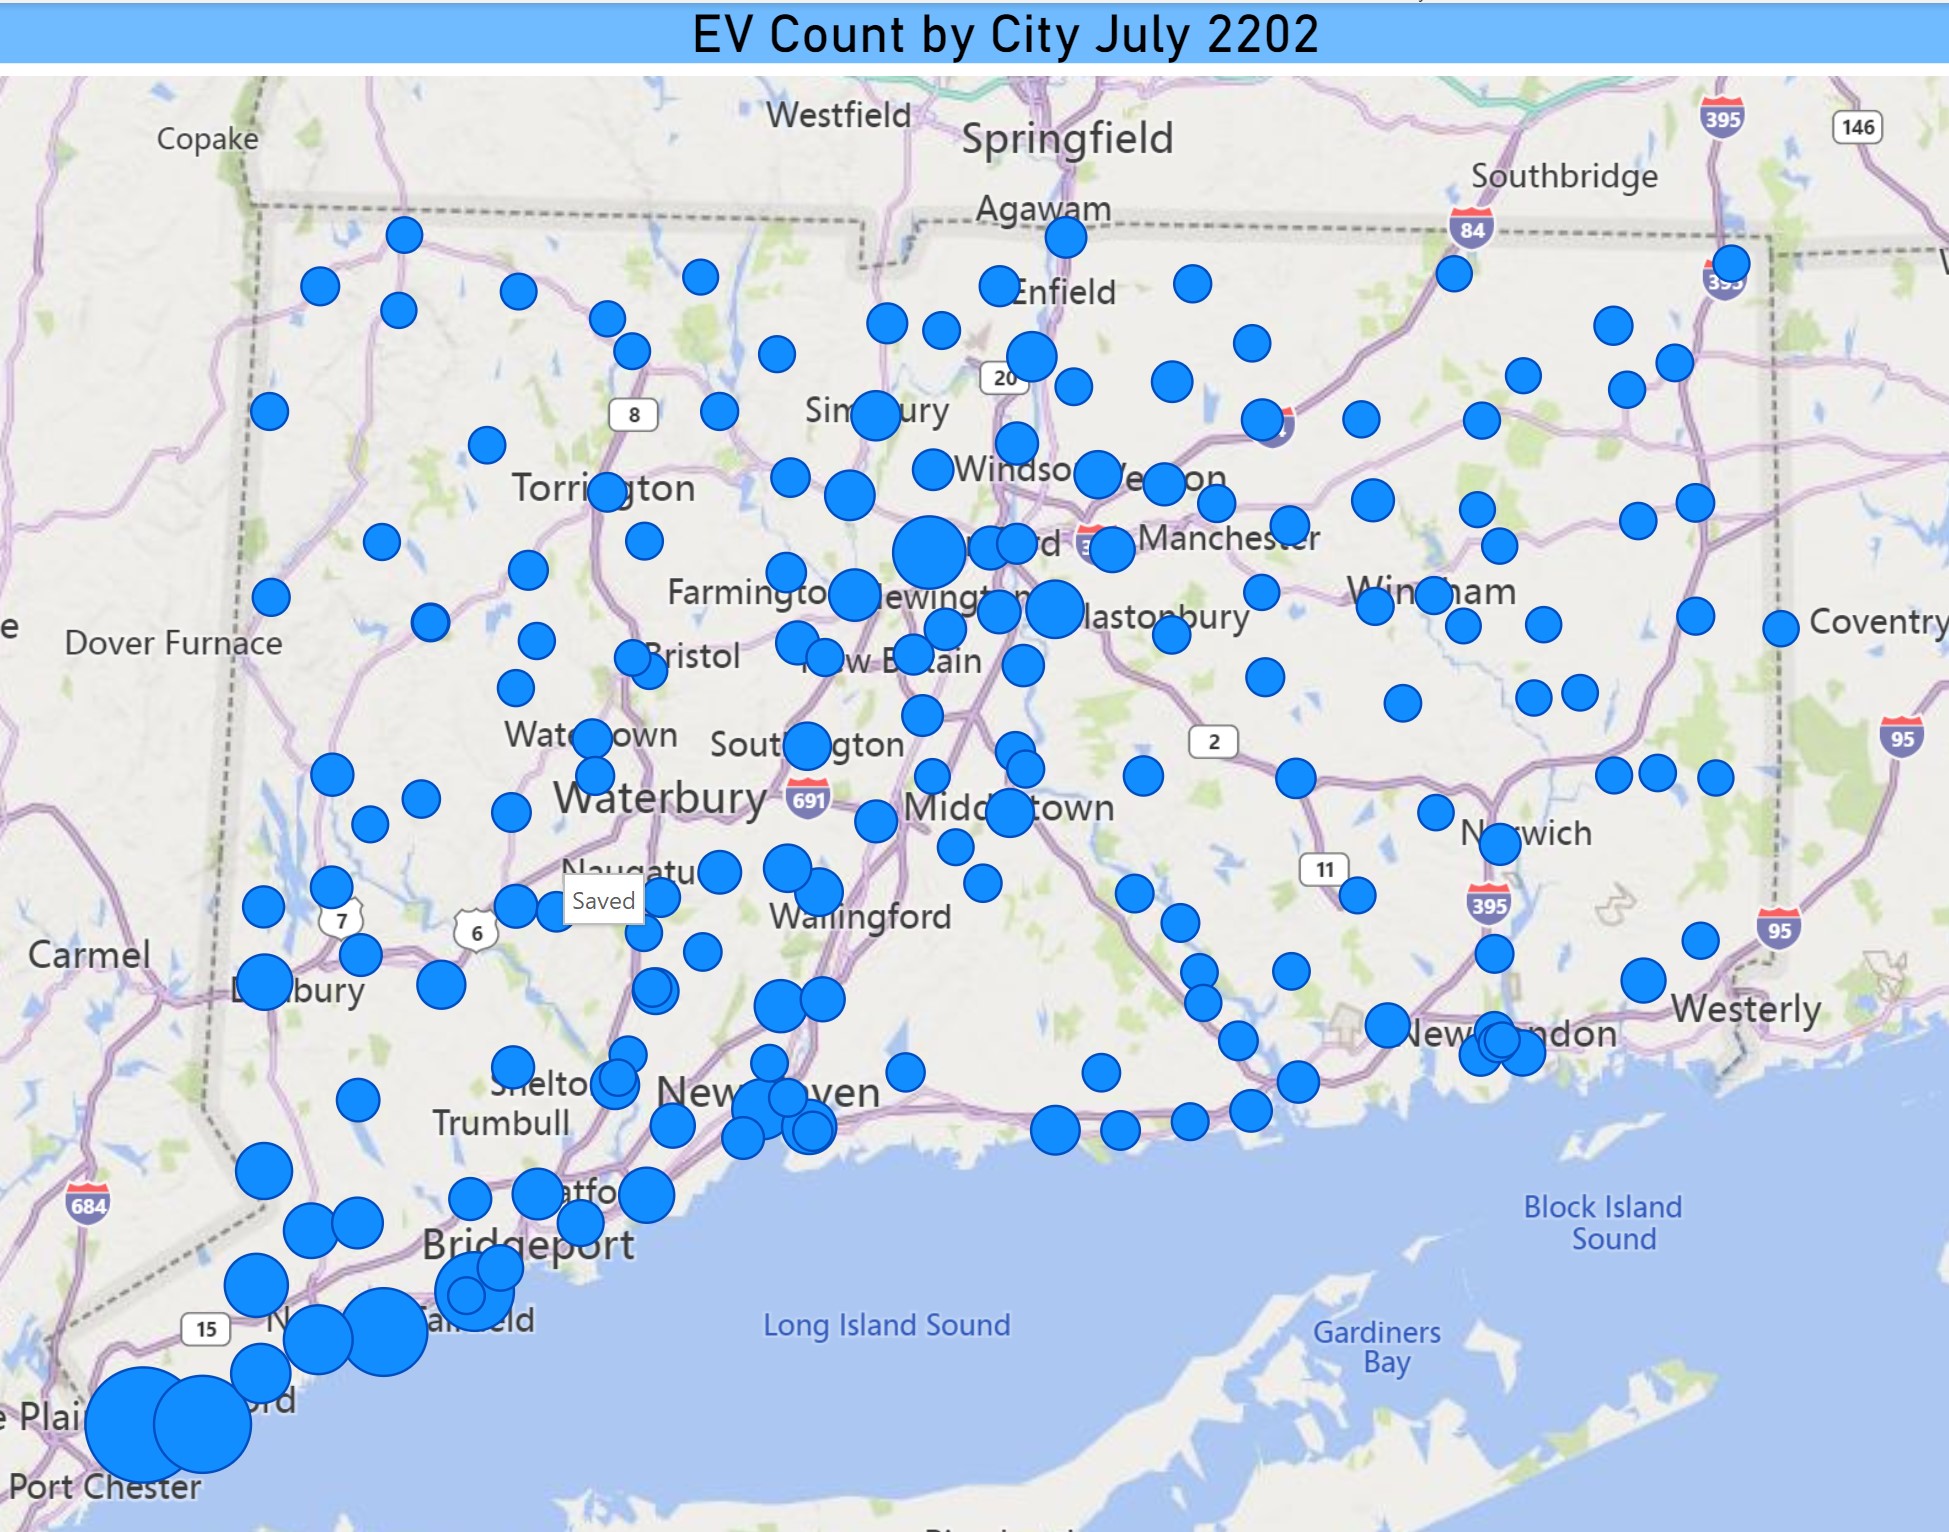
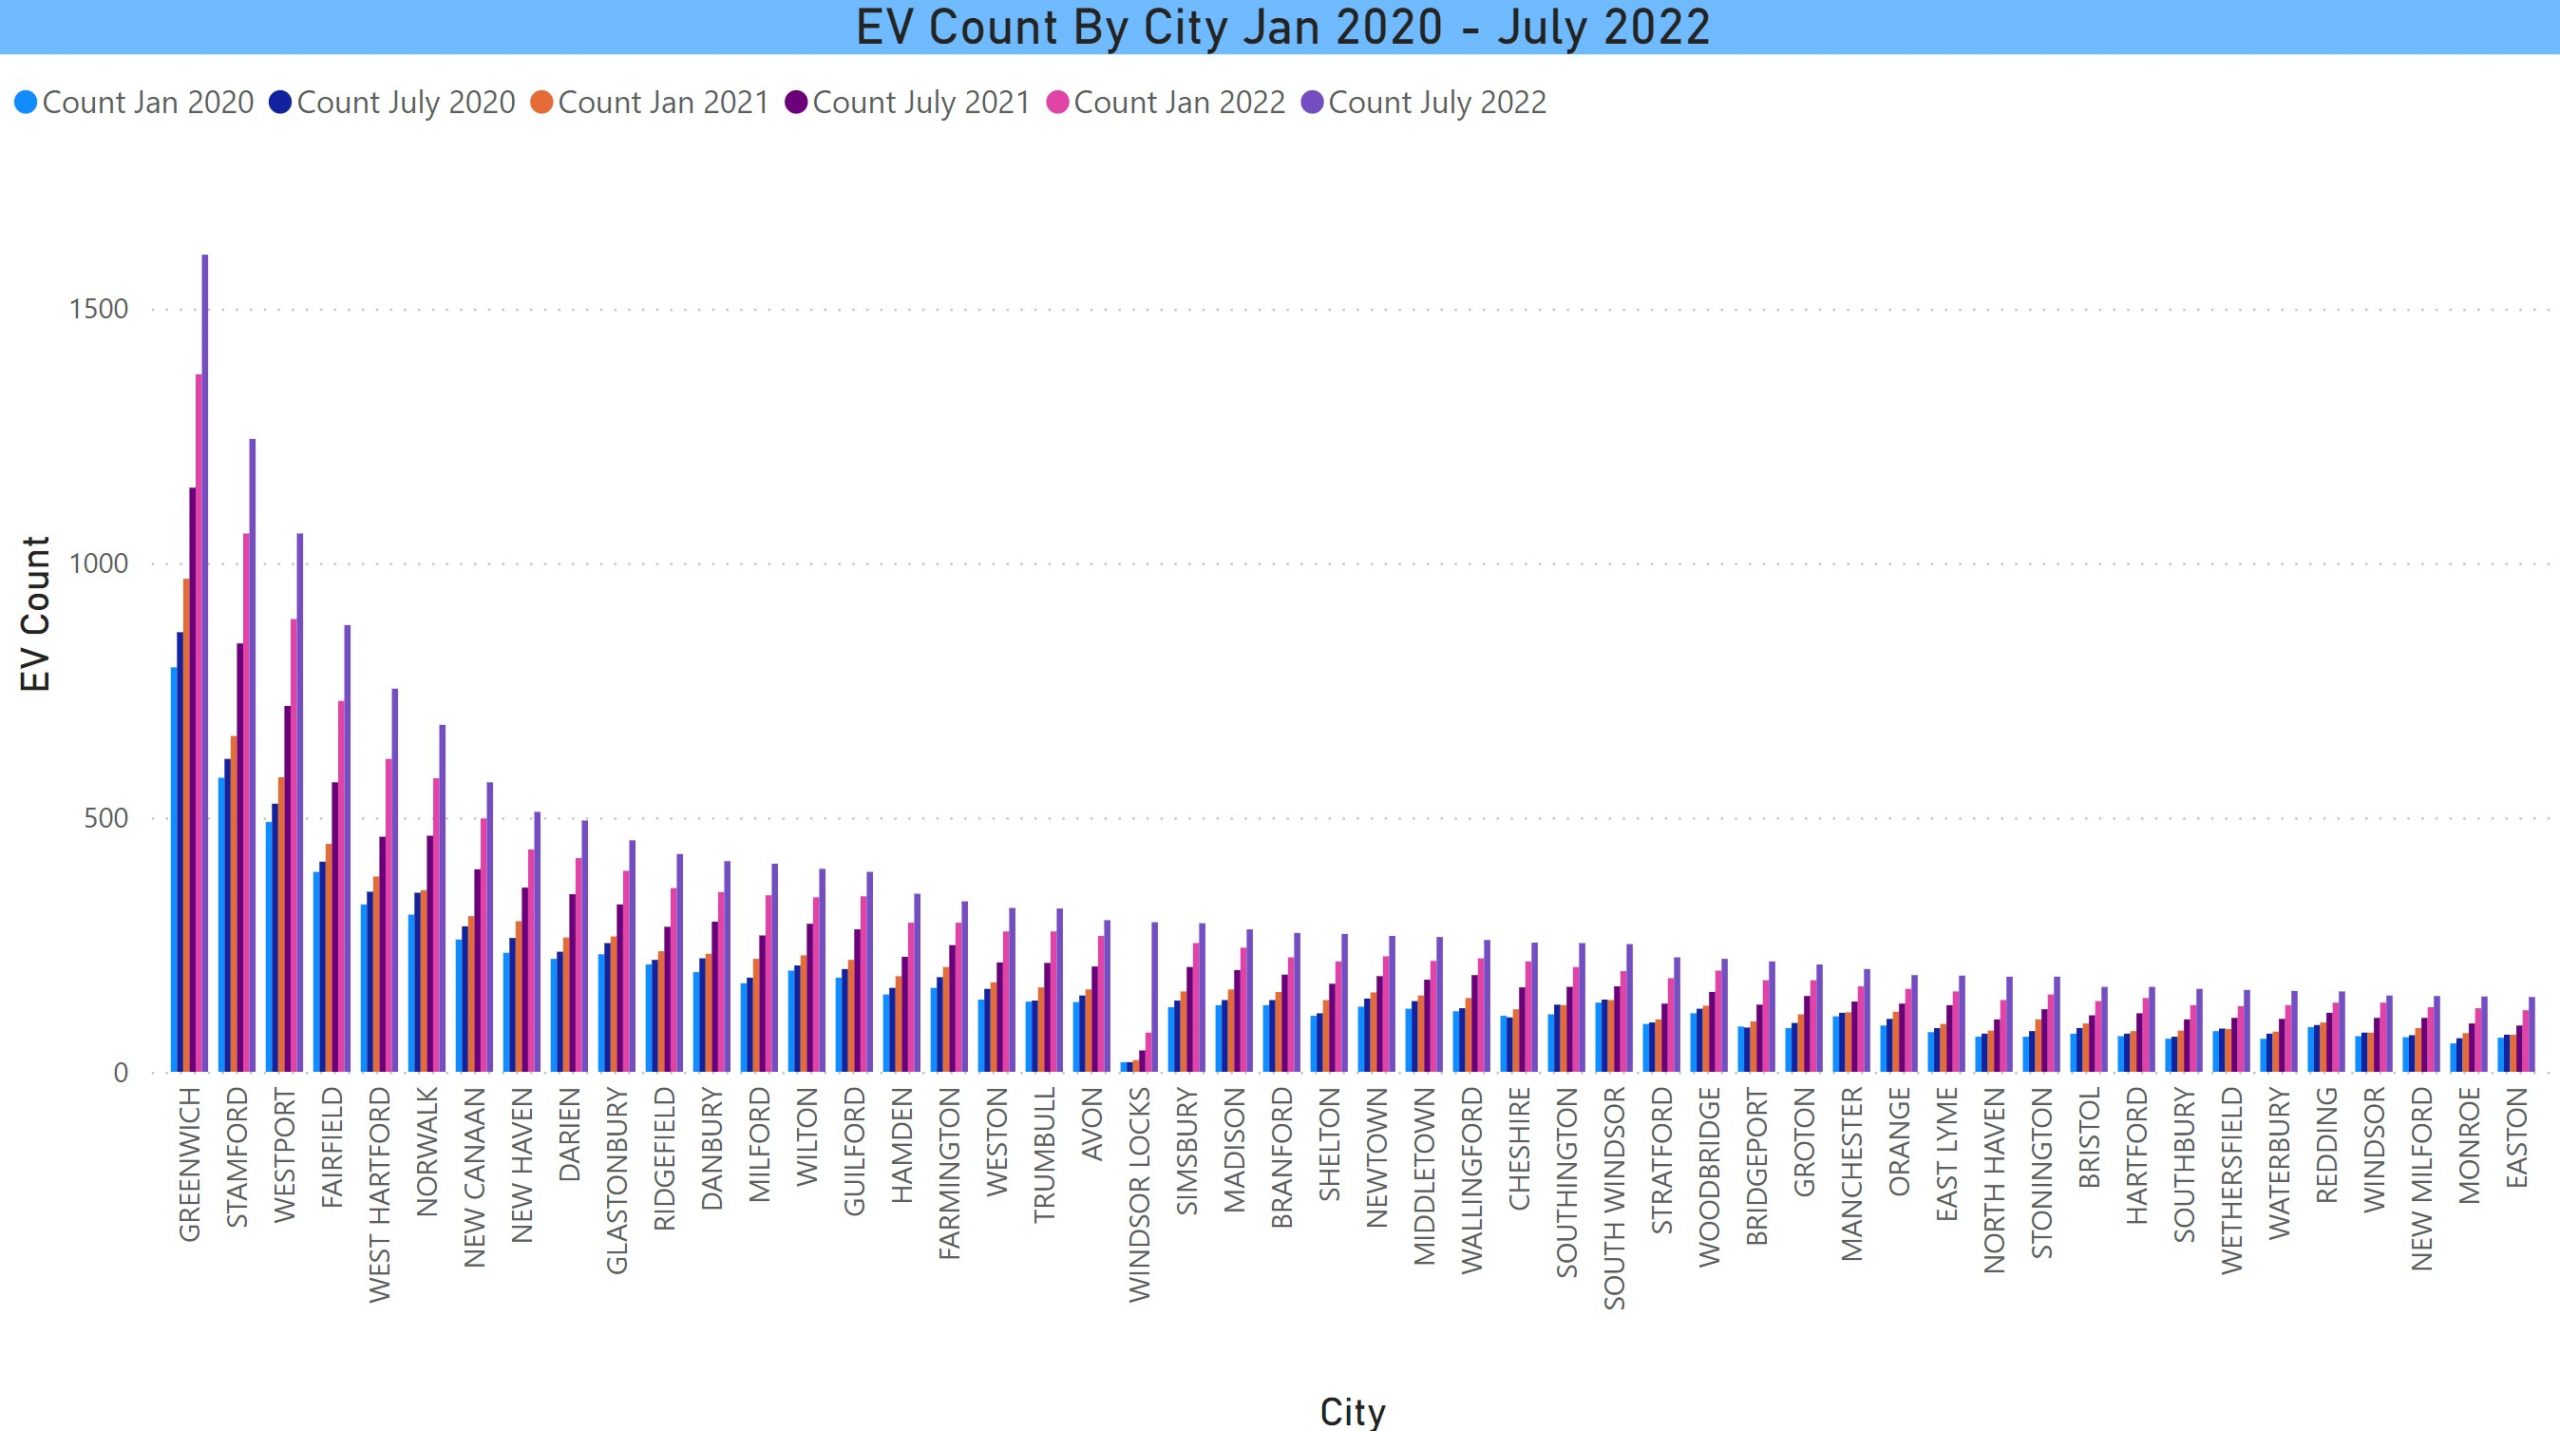
Greenwich, Stamford, and Westport retain their positions as the top cities in terms of EV registrations. This is the trend by city since January of 2020. While the top cities have remained consistent, there are shifting ranks among a number of cities. The top 3 have now exceeded 1000 registered EVs. In this static screenshot, there isn’t enough room to display all cities. They will be able to be seen when the dashboard is published (soon).
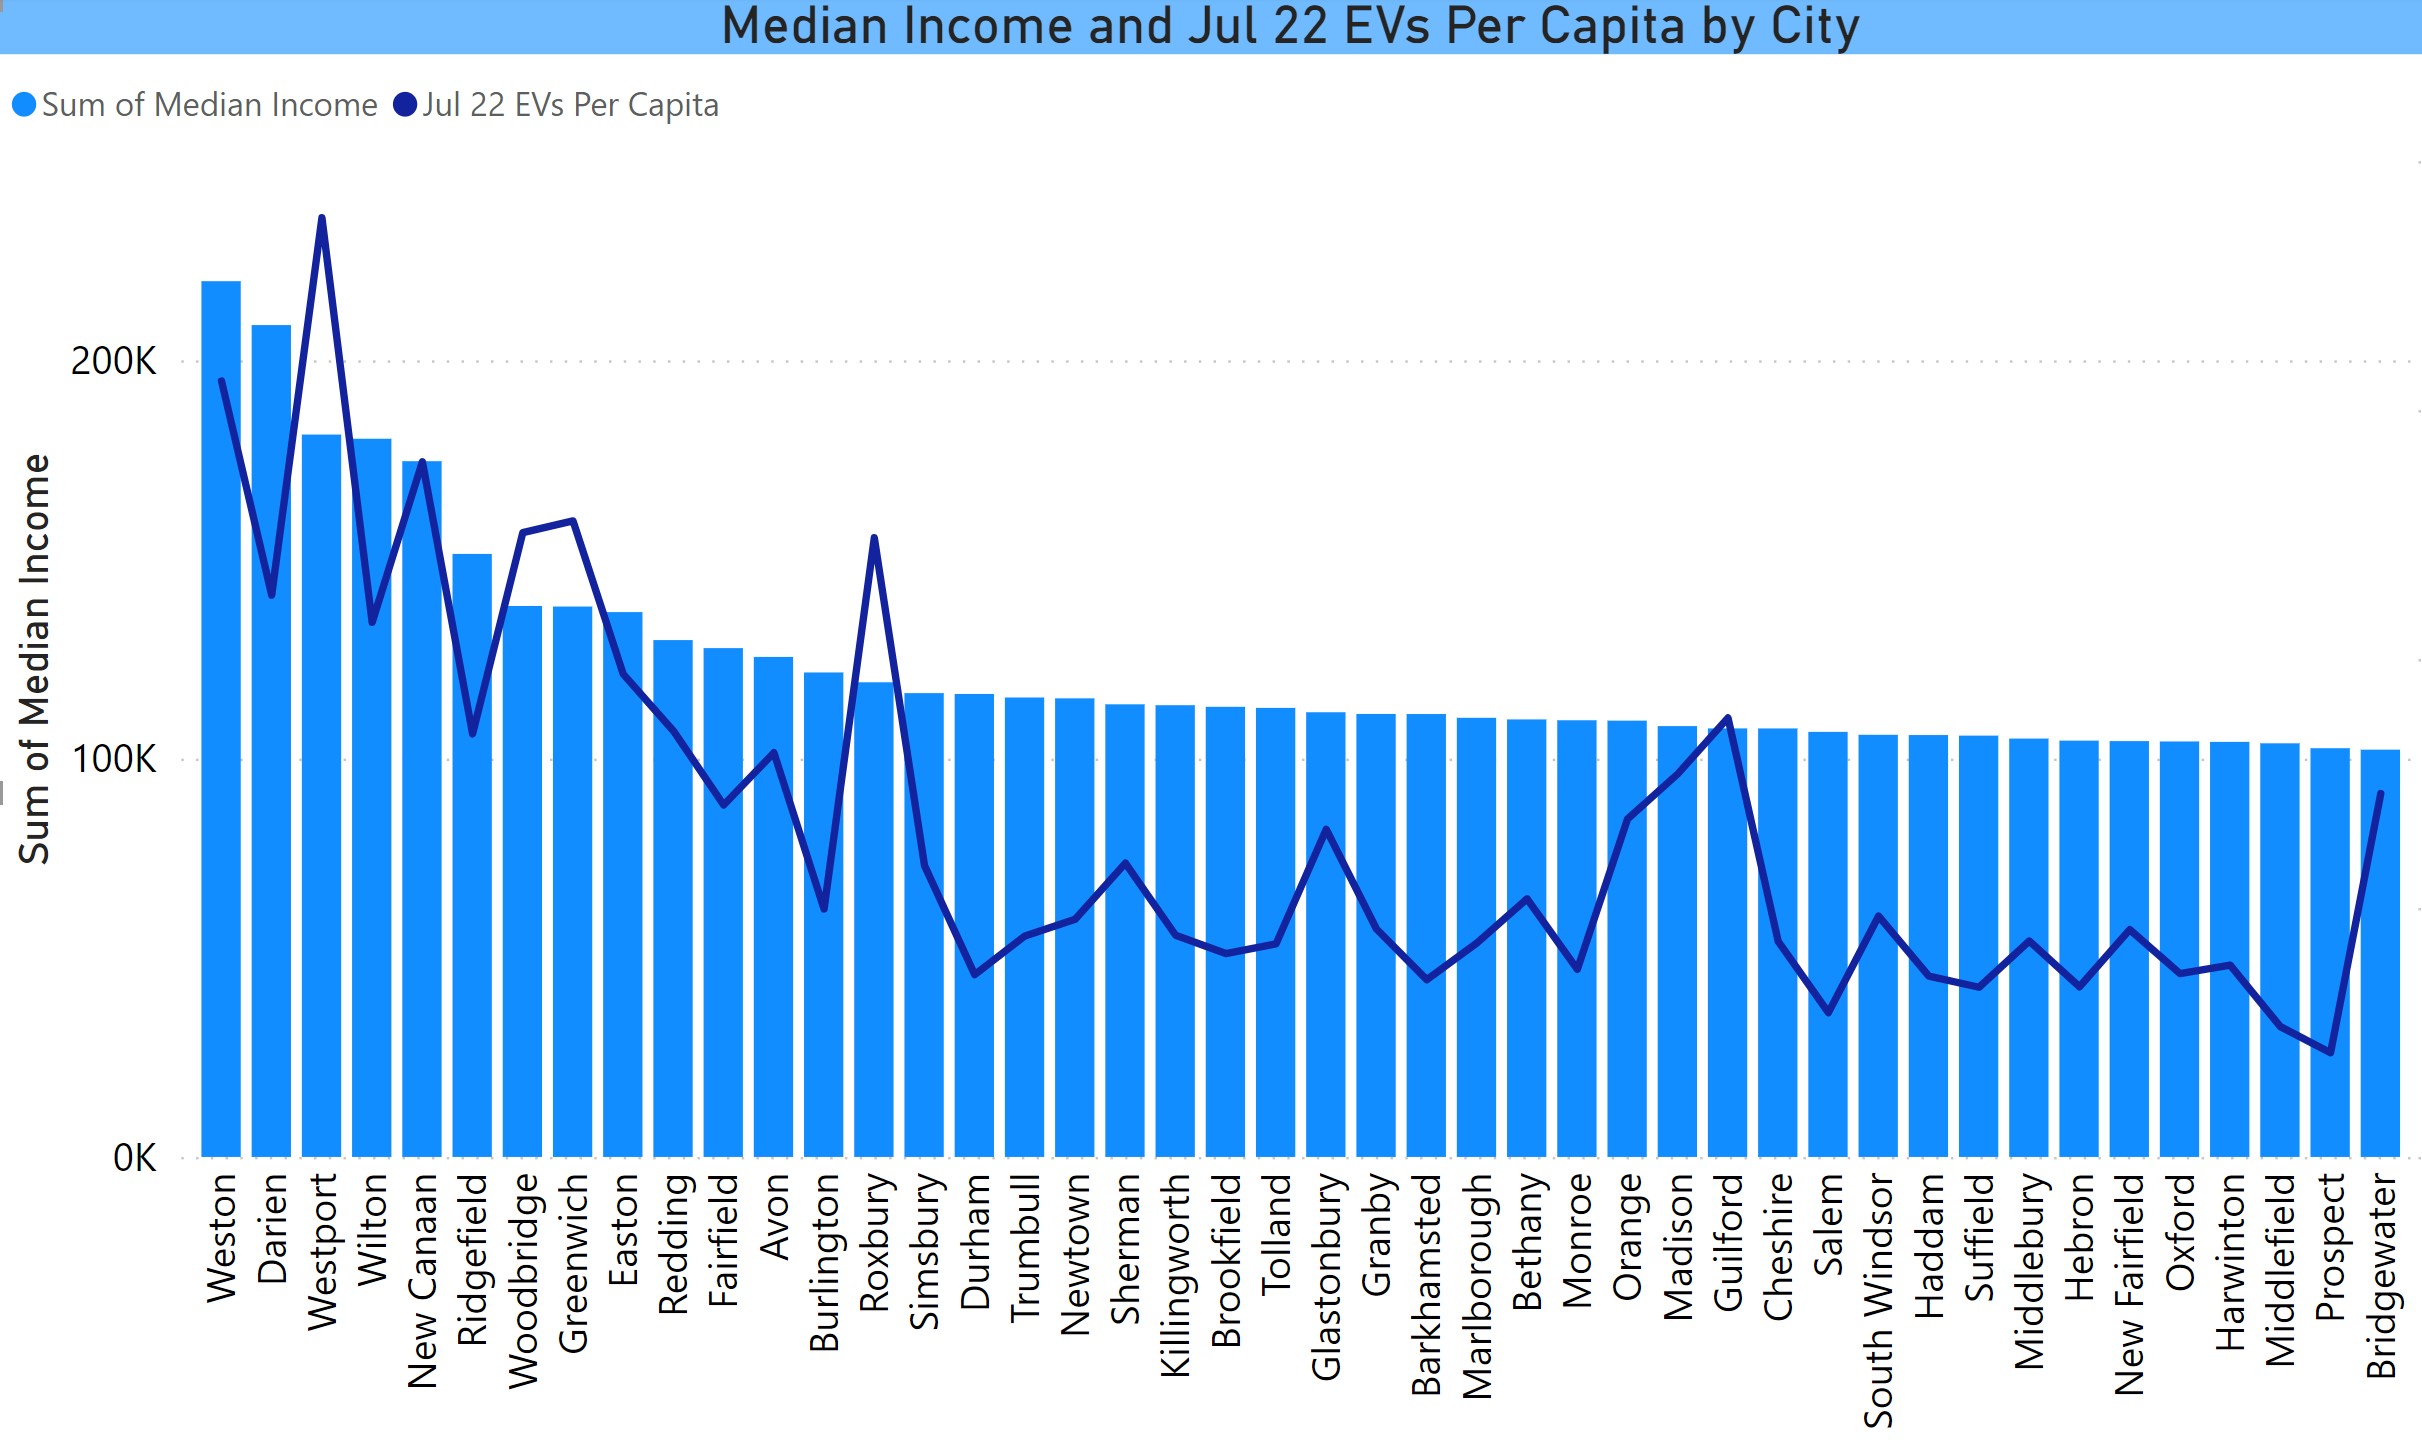
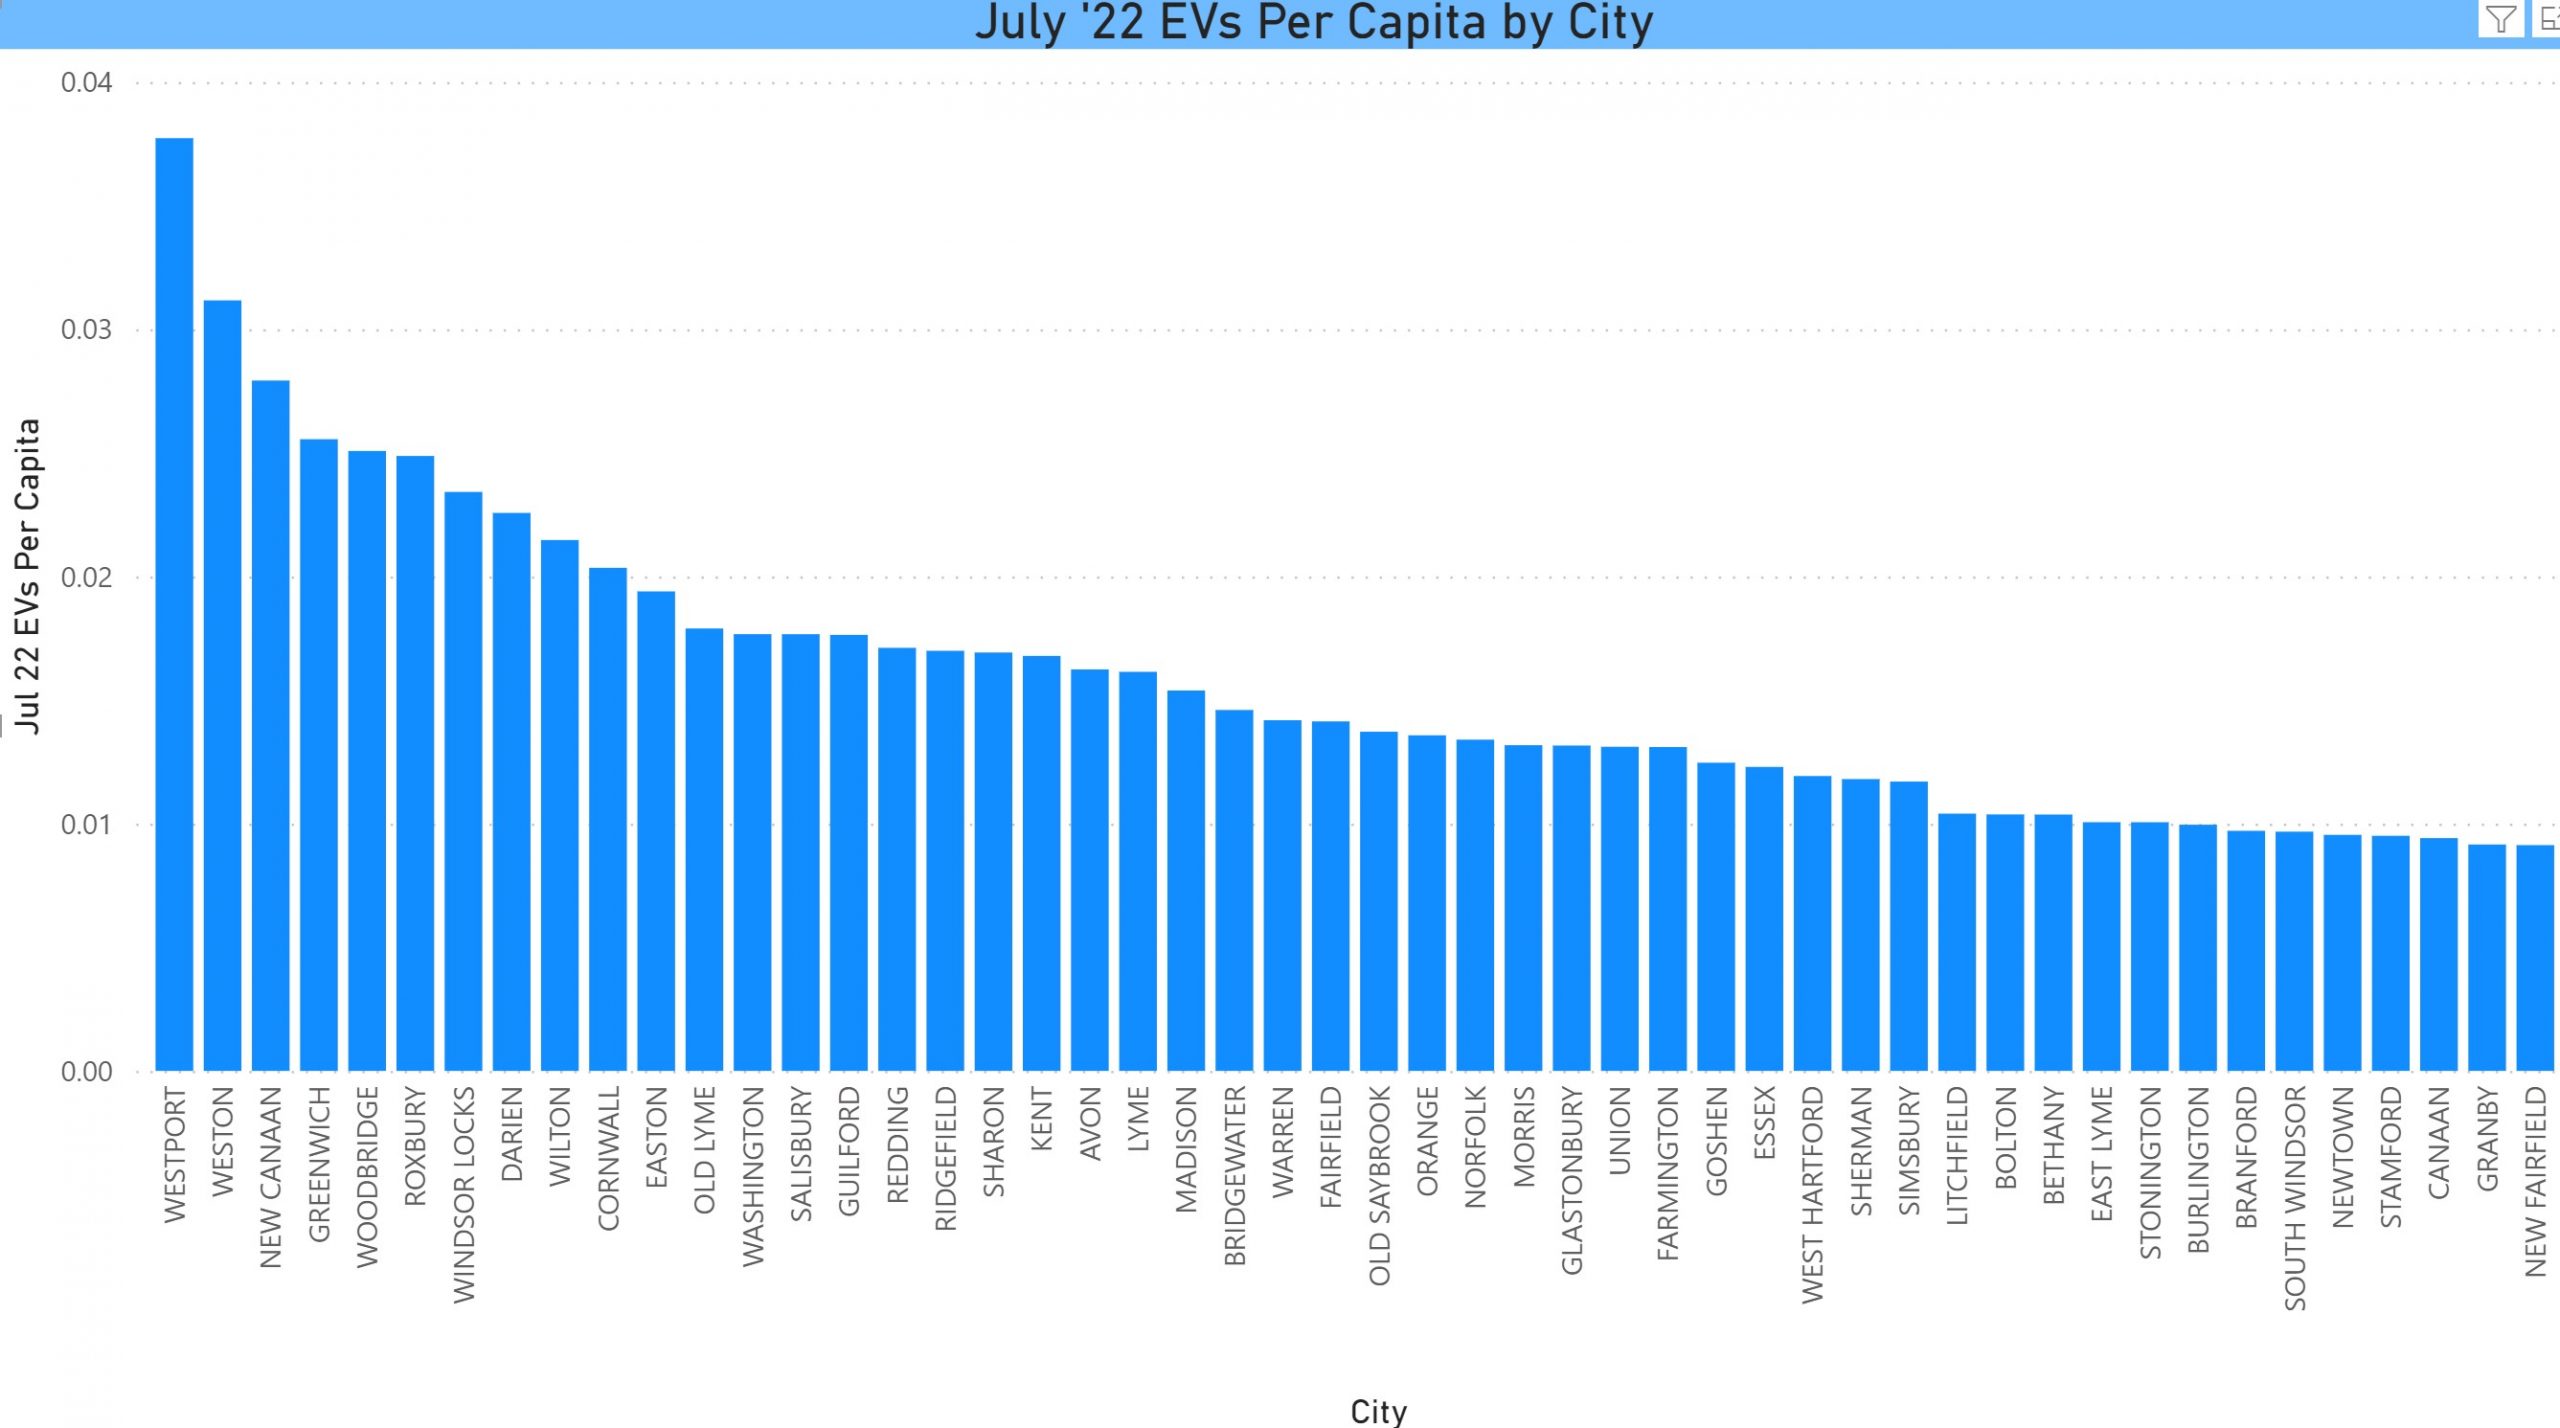
Westport remains the top city in EVs per capita, but some of the smaller cities, such as Weston and New Canaan are near the top when adjusted for population.
Below is a chart of cities ranked by median income (bars) with a linear overlay of EVs per capita. Yes, EV adoption still skews upmarket, though there are exceptions, not all of them visible within the space of the screenshot.