Electric Vehicle Interactive Dashboard 2018 Update – 35% Increase in CT EVs

Updated EV Dashboard

The EV Interactive Dashboard is now updated. There are now 2 years of data represented in the model: February 2018 and March 2018. The data are a snapshot from these two points in time.

This comes to us from the CT Department of Motor Vehicles. Club President Bruce Becker filed a Freedom of Information Act to obtain it. The file includes every vehicle registered in the state of Connecticut.

A few words about the dataset.

There is no personal information. The fields that are given to us are make, model, model year, city, and fuel type. There is no plug-in hybrid (PHEV) fuel type in the file. We build that from the vehicle model. We then overlay census data that allows us to consolidate cities to counties, incorporate median household income by city, and calculate per capita stats.

To reinforce a couple of key points, the data in the file are not vehicle sales; it is the current vehicle fleet in the state of CT. It doesn’t matter if someone owns, leases, bought new or used. The year is the model year of the registered vehicle and should not be interpreted to be sales by year.

The model is interactive. The checkboxes are “slicers.” Checking a box will cross-filter all of the charts on that page. Similarly, clicking into a chart element will also cross-filter. You can click on more than one check box. If you are on a Mac, depress the command key while clicking. For PC, use the CTRL key. Hovering over a chart element will cause the value to display.

This model has multiple pages. The page bar is at the bottom of the screen.

Click here to spawn a web browser version of the dashboard

The browser version is a little balky, but such is life. If anyone has a PBI subscription and wants to see a PBI.com dash, send an email to WestportEVClub@gmail.com.

Look to upcoming posts to see our take on the highlights from the data set.


EV Ownership Grows 35% in CT

35% Increase in 2017

The number of plug-in vehicles registered in CT has grown by 35.1% in a comparison of 2 data points one year apart.

The Westport Electric Car Club received an updated vehicle ownership file from the CT Department of Motor Vehicles which was obtained via a Freedom of Information Act request. This enables us to make comparisons with a similar file acquired 1 year ago. These files contain no personal data, just make, model, model year, and city.


This translates to 6264 vehicles this year compared to 4636 the prior year. The term EV includes both battery electric vehicles (BEV) and plug-in hybrid vehicles (PHEV). EVs represent .28% of all vehicles registered in the state this year, up from .20% last year. EV sales have been growing by double digit percentage increases for several years now, but when looking at a number like .28% of all vehicles, the context is that these recently manufactured EVs are in a file that contains all of the existing fleet in the state.

Keep in mind that these data points are static snapshots of vehicles registered. It is not the same as new car sales. It would include the purchase of used vehicles and it would not include vehicles that were sold or had a lease expiry. Broadly speaking, since they aren’t the same numbers, this 35% increase compares with a 26% increase in the sales of new EVs nationally in 2017 vs. 2016. As this post is being written the March 2018 EV sales figures are being released. Inside EVs is reporting a record month, with EV sales up 43% compared to March 2017.

Makes

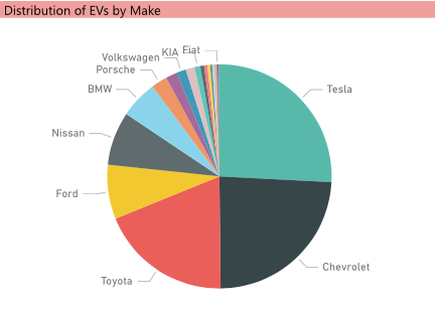
The most widely represented EV make in CT remains Tesla with 1617 vehicles, followed by Chevrolet with 1504 and Toyota with 1191.

Cities

With respect to cities, Greenwich remains the city with the most EVs at 511. Westport is third with 266, though it has the highest per capita incidence of EVs at 1%, roughly 3.5 times the incidence of the state as a whole.


One of the most frequent questions we got when we did our analysis last year was how many fuel-cell vehicles were in the file. The answer this year is the same as last year: NONE!


There were several new models represented this year, including the Honda Clarity PHEV, Chrysler Pacifica PHEV, and the Mini-Cooper PHEV.

Increases

The makes with the largest percentage increases among those with a major EV presence (arbitrarily defined as at least 300 units) are Chevrolet at 52.4%, Toyota at 51.9%, Nissan at 33.3%, and Tesla at 21.4%. The Chevy increase was driven by the introduction of the BEV Bolt. Toyota introduced the Prius Prime, the new version of its plug-in Prius which is selling much better than the previous model. Nissan is transitioning to the new Leaf.


The elephant in the room is, of course, the Tesla Model 3. Given that Tesla is the most widely represented EV brand in the state and given the fact that there is a backlog of unfilled reservations, if Tesla manages to wrangle its manufacturing bottleneck, it could change the complexion of the numbers. There were only 4 Model 3s included in this file. During recent testimony in Hartford, Tesla reported having over 3000 Model 3 reservations in the state. In Westport, Tesla represents 51% of all plug-ins and it accounts for 8.3% of all of the Teslas registered in the state. That projects out to something like 250-300 Model 3 reservations in Westport. In other words, if this is accurate, it represents a number roughly equal to all of the plug-ins currently registered in the town.


We won’t know for a while about the Model 3, but we will be following up with additional information from our analysis of the data and an update to our interactive dashboard. Stay tuned!