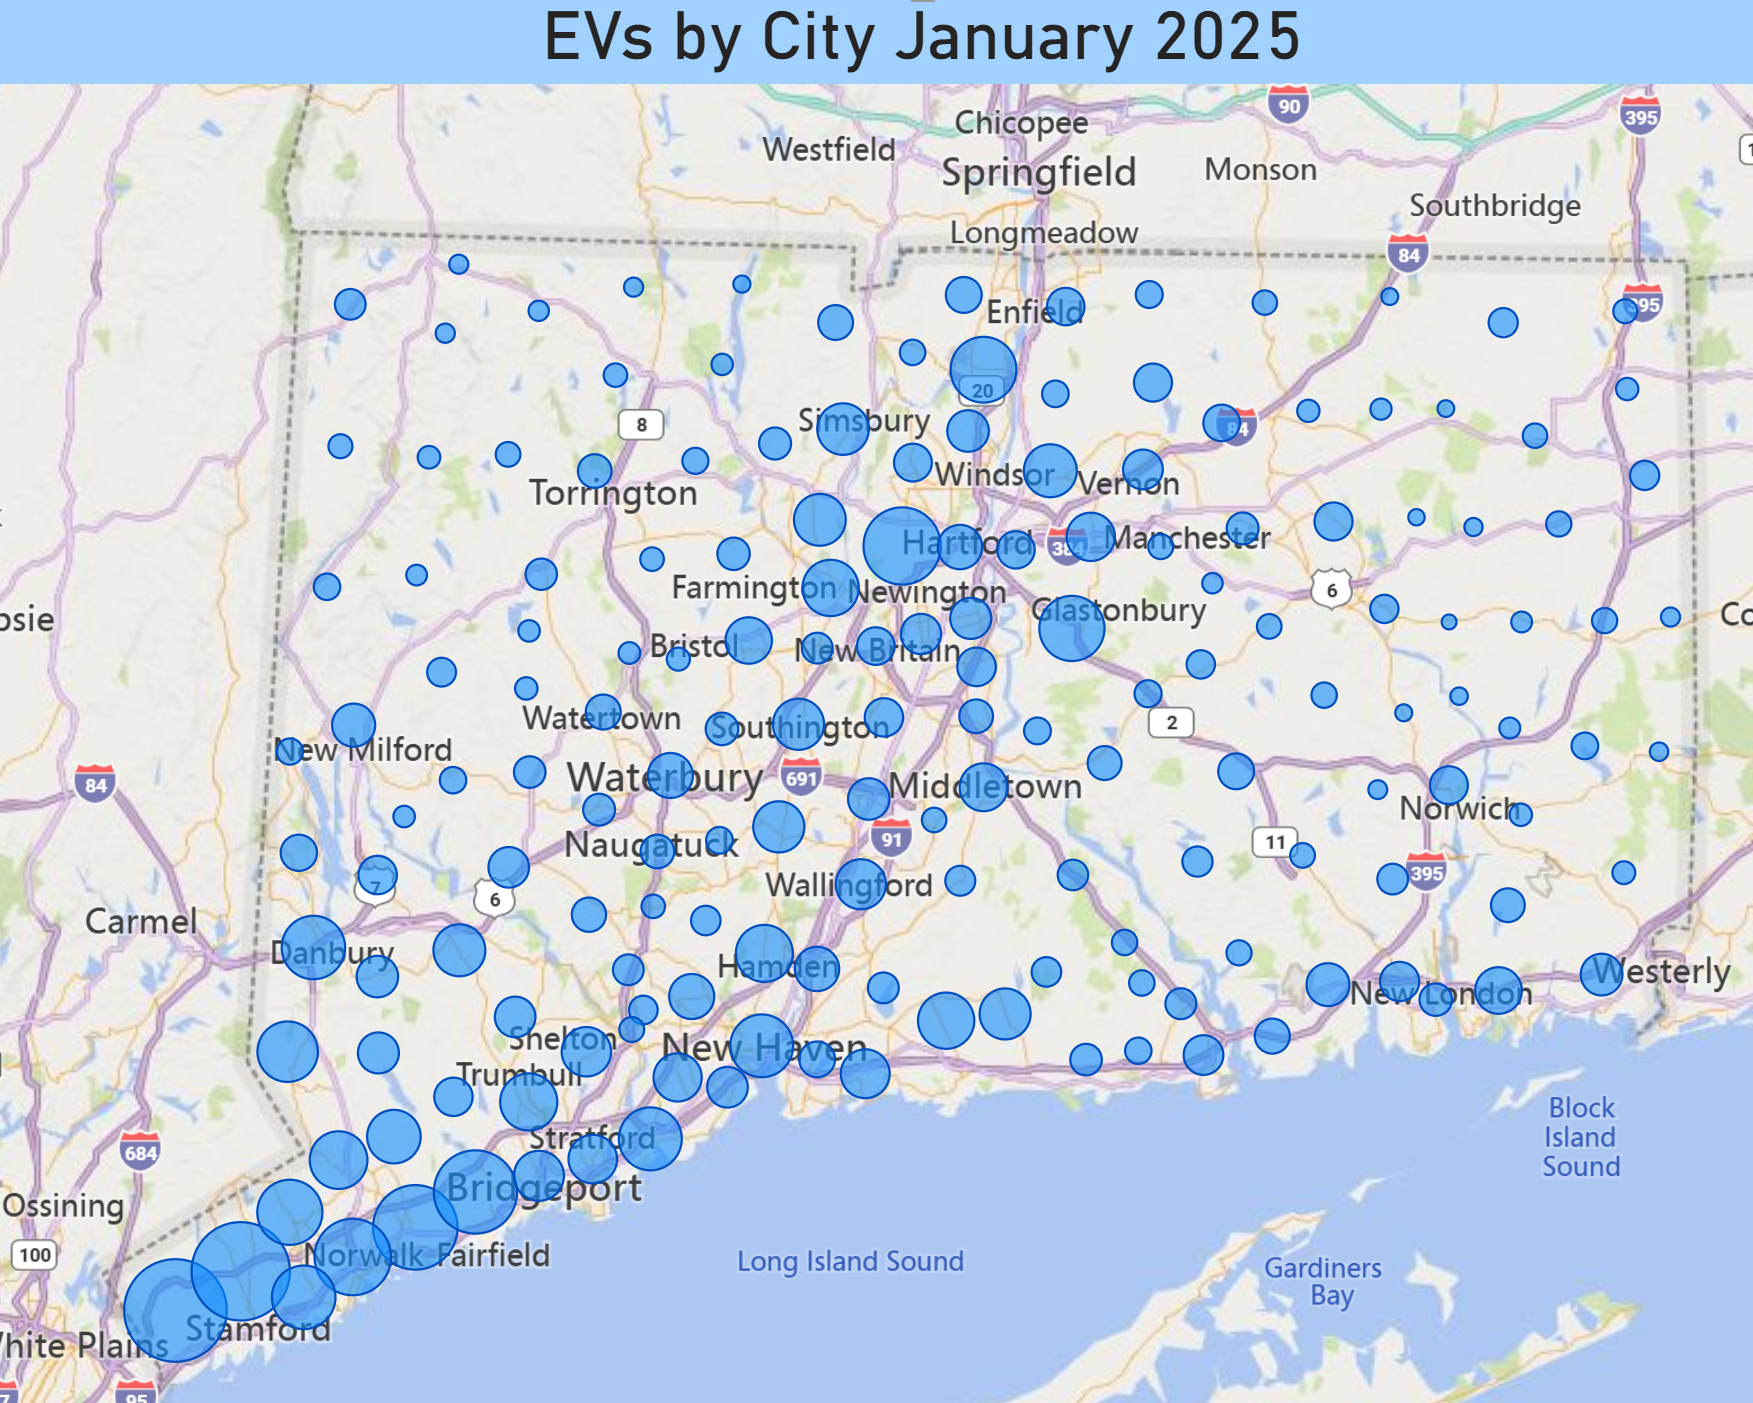
Bubble size in the graphic above represents the number of registered electric vehicles for each city in the state.
The registration numbers for Connecticut have been released. The total number now stands at 60,489 as of January 1, 2025. Battery electric vehicles still dominate as described in this earlier post.
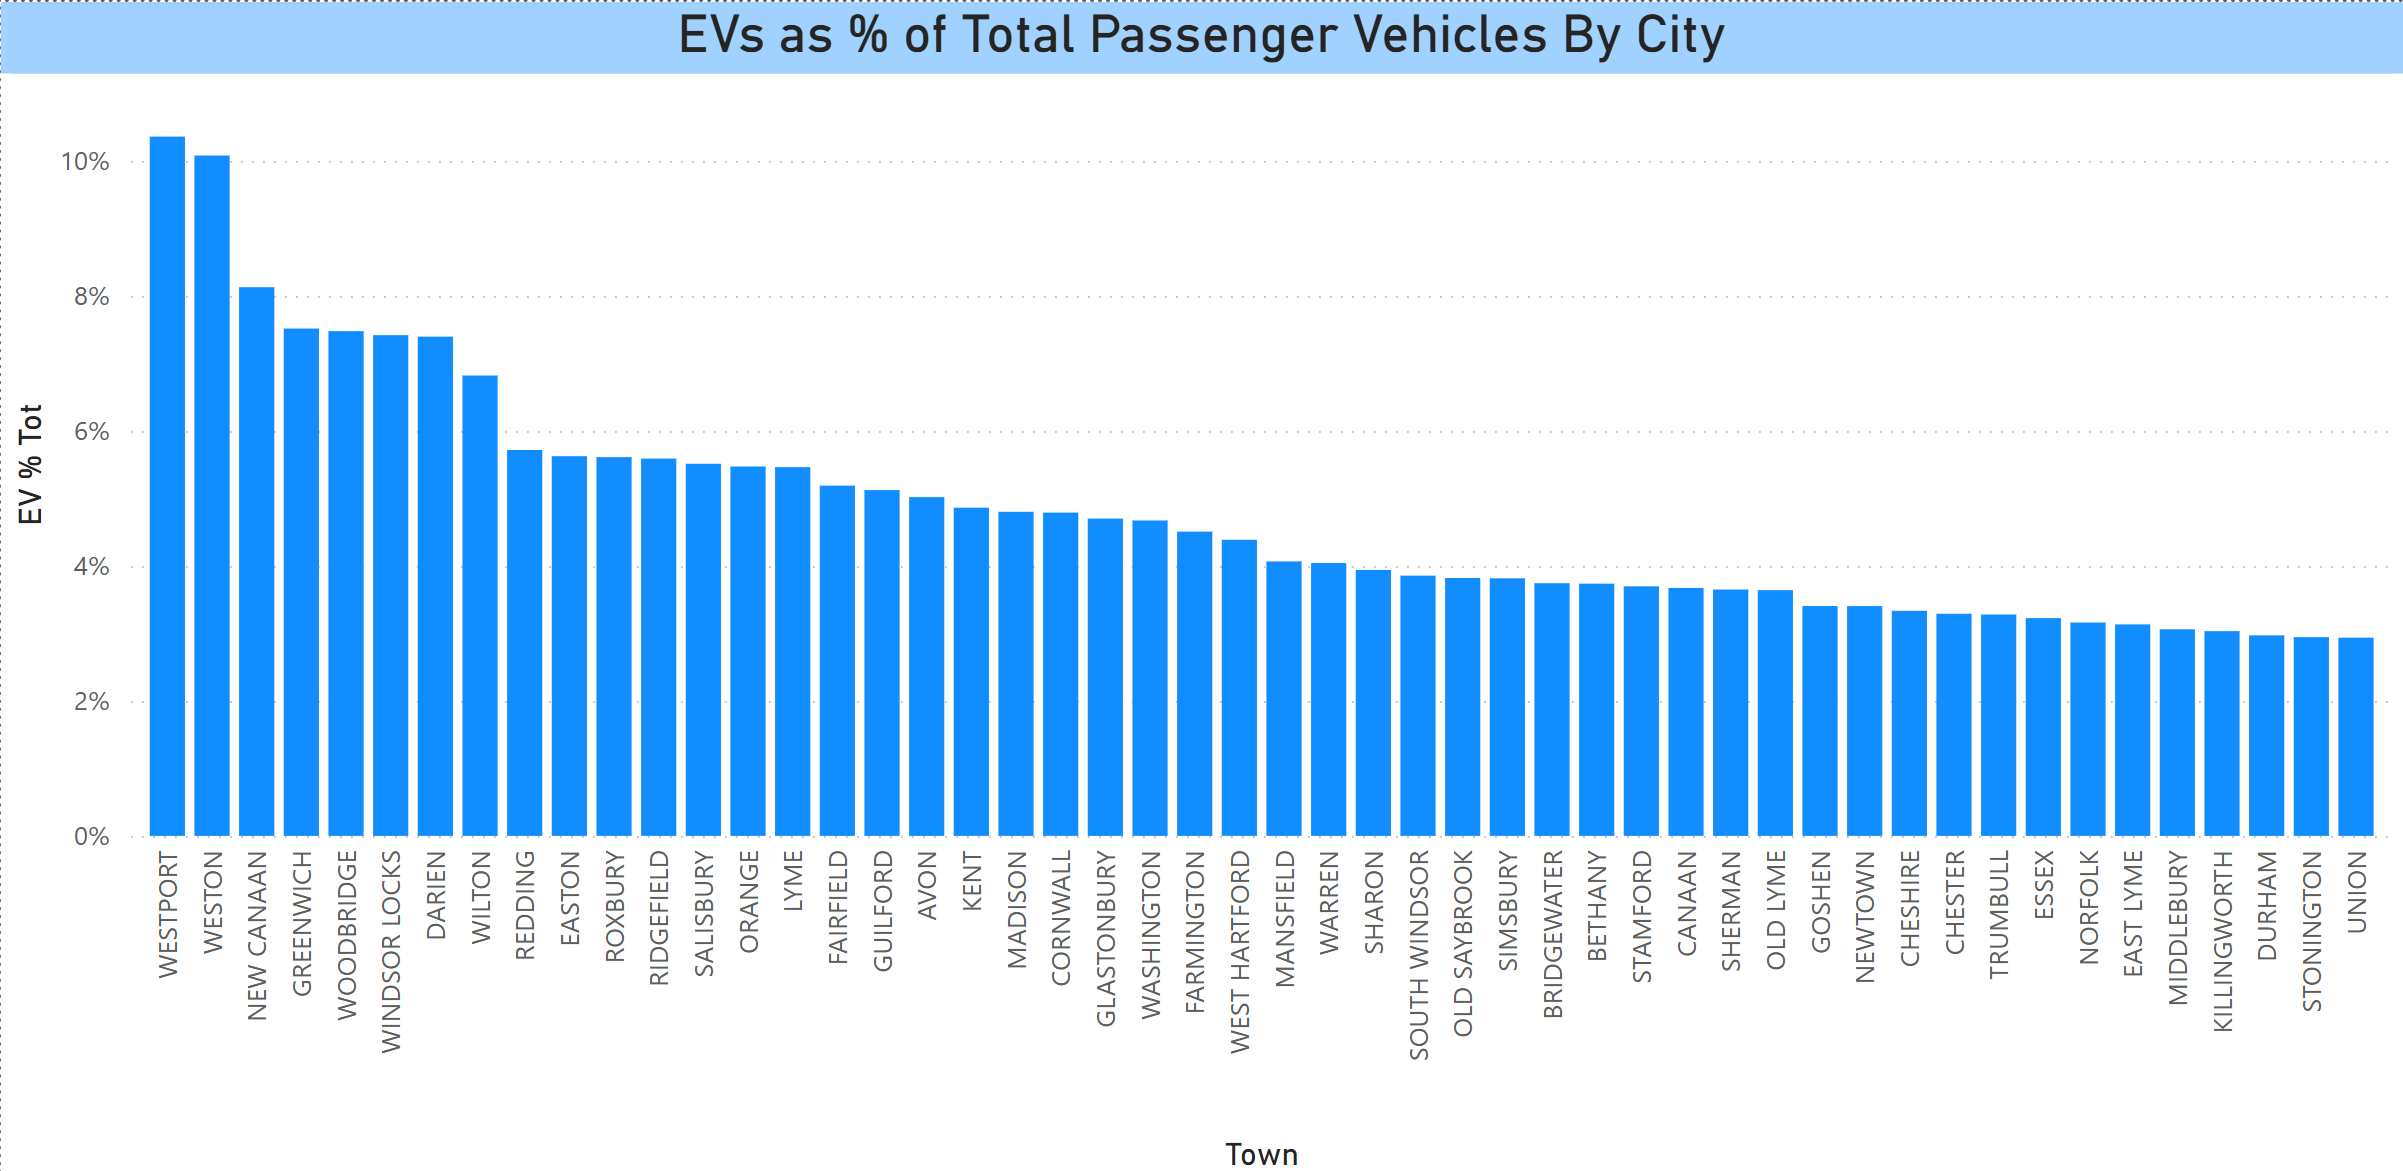
Two Towns Become First to Have Registered EVs Exceed 10% of All Passenger Vehicles
Westport and Weston crossed the 10% threshold with the percentage of registered vehicles being electric at 10.4% and 10.1%, respectively. These towns were followed by New Canaan at 8.1%, and Greenwich and Woodbridge at 7.5%.
The overall statewide rate is 2.7%. Below is a bar chart of EVs as a percentage of vehicles for the top cities and towns. There is too much data to display every city. If anyone is interested, please reach out to the EV Club and we can give you the information.
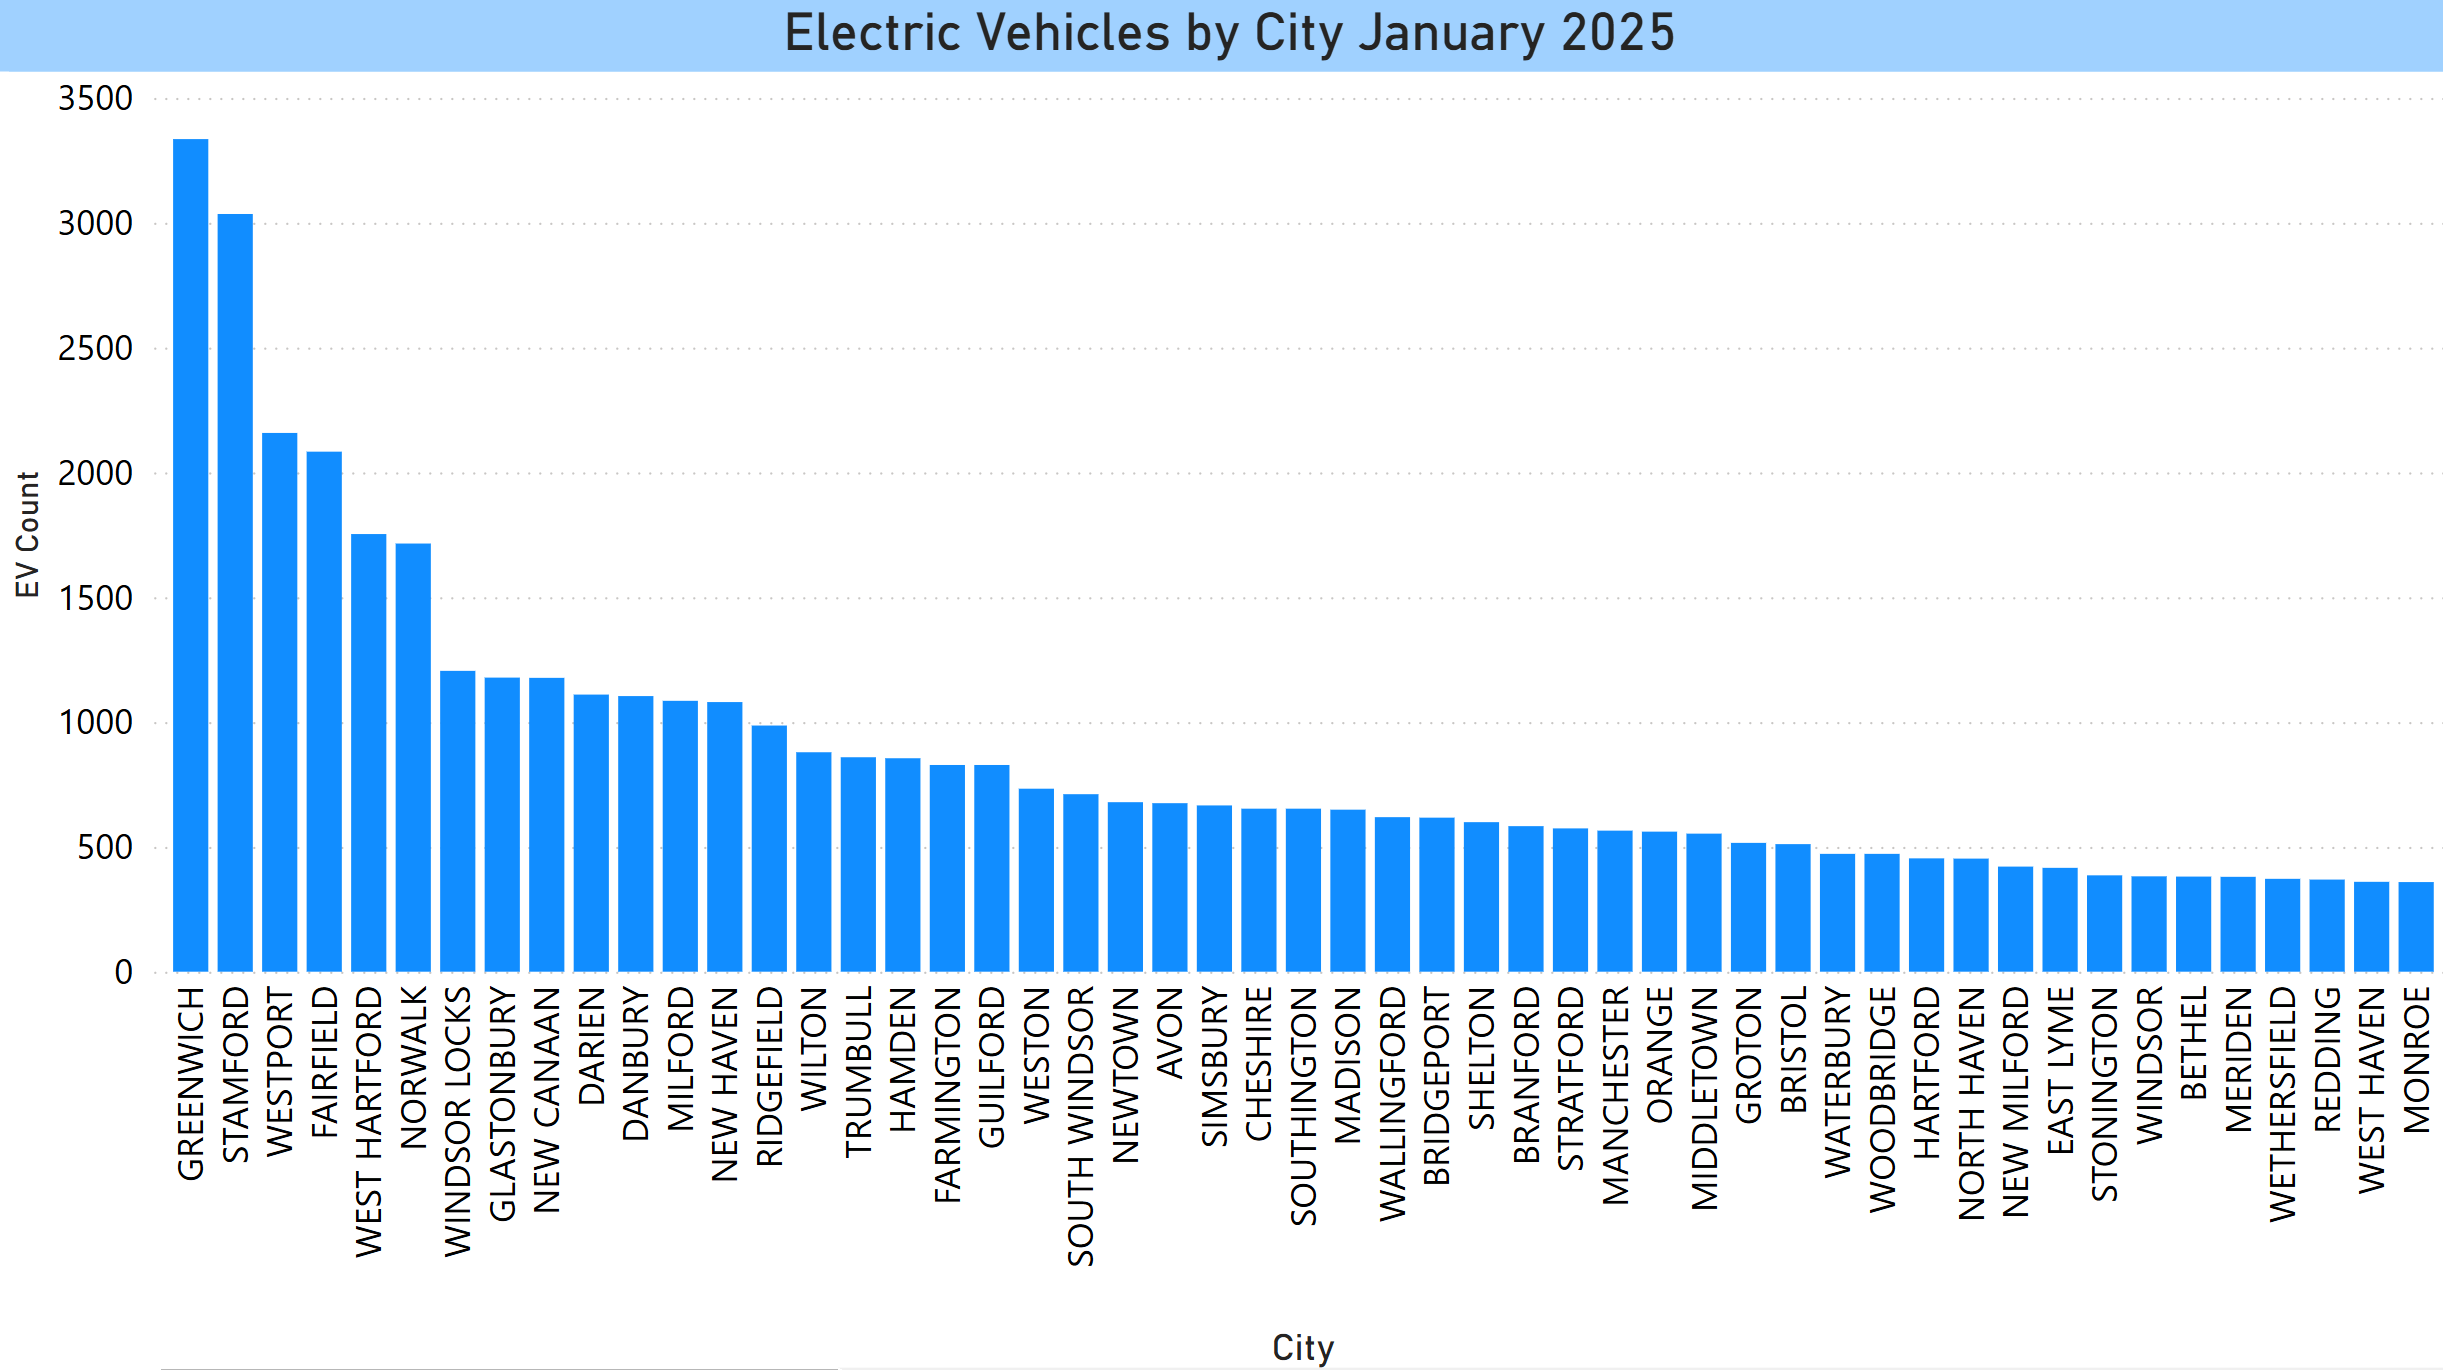
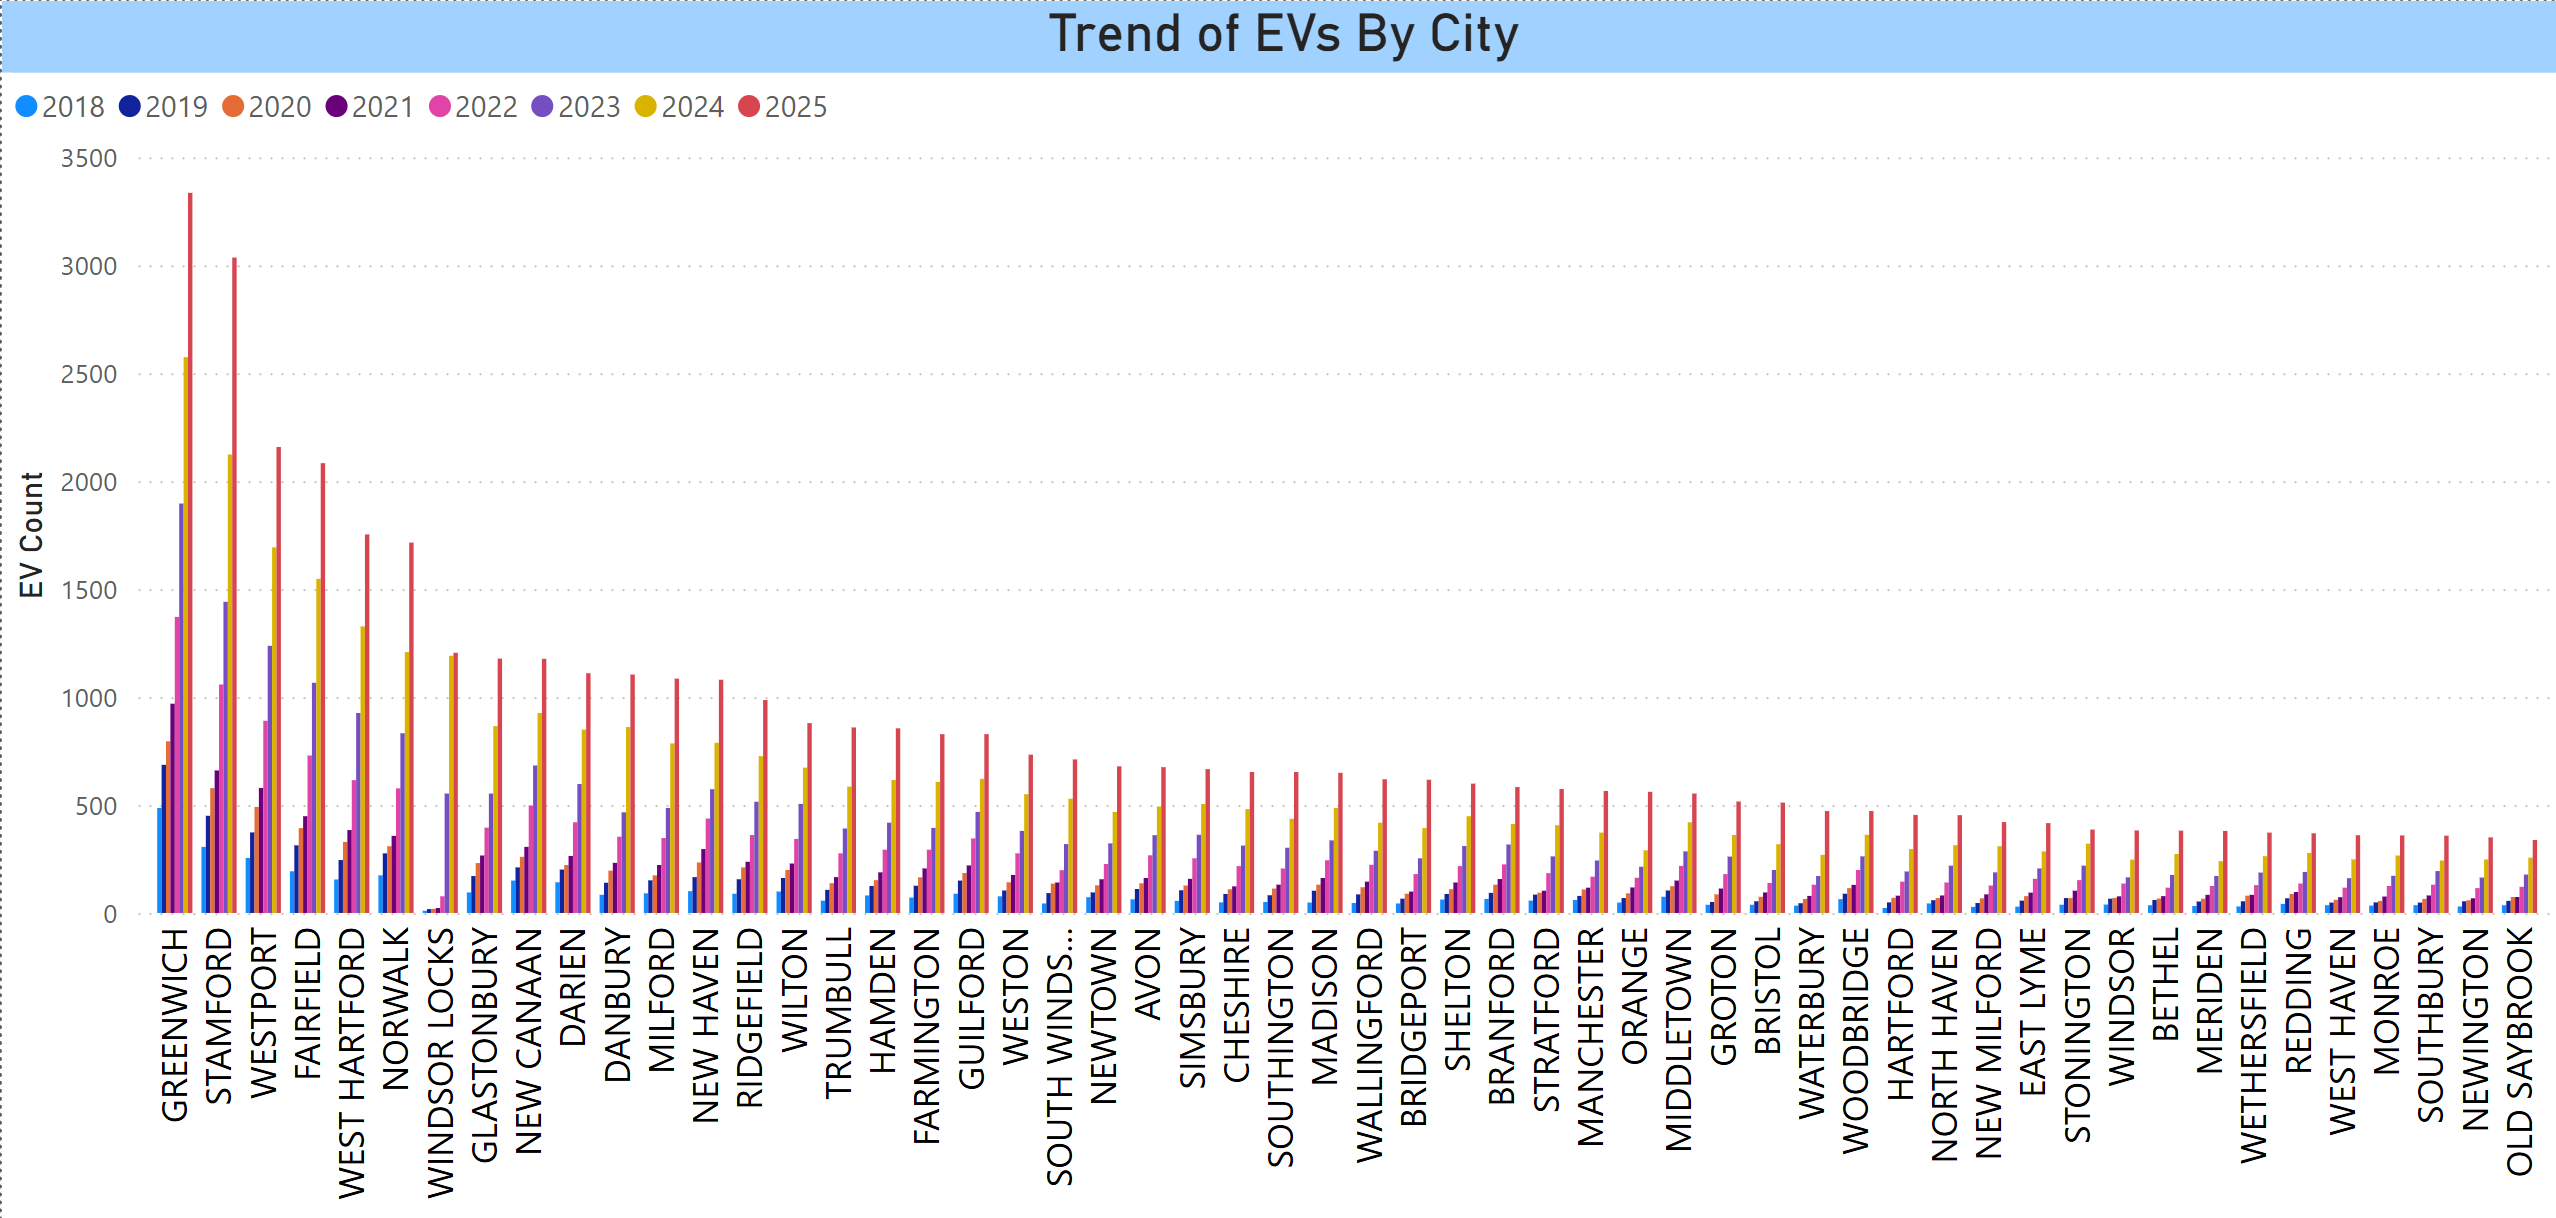
Count of Registered EVs by City
In terms of raw EV counts, Greenwich remains at the top with 3335 registered EVs, followed by Stamford (3035), Westport (2158), Fairfield (2083), and West Hartford (1753). The charts below are for the 2025 numbers and trended numbers going back to 2018.
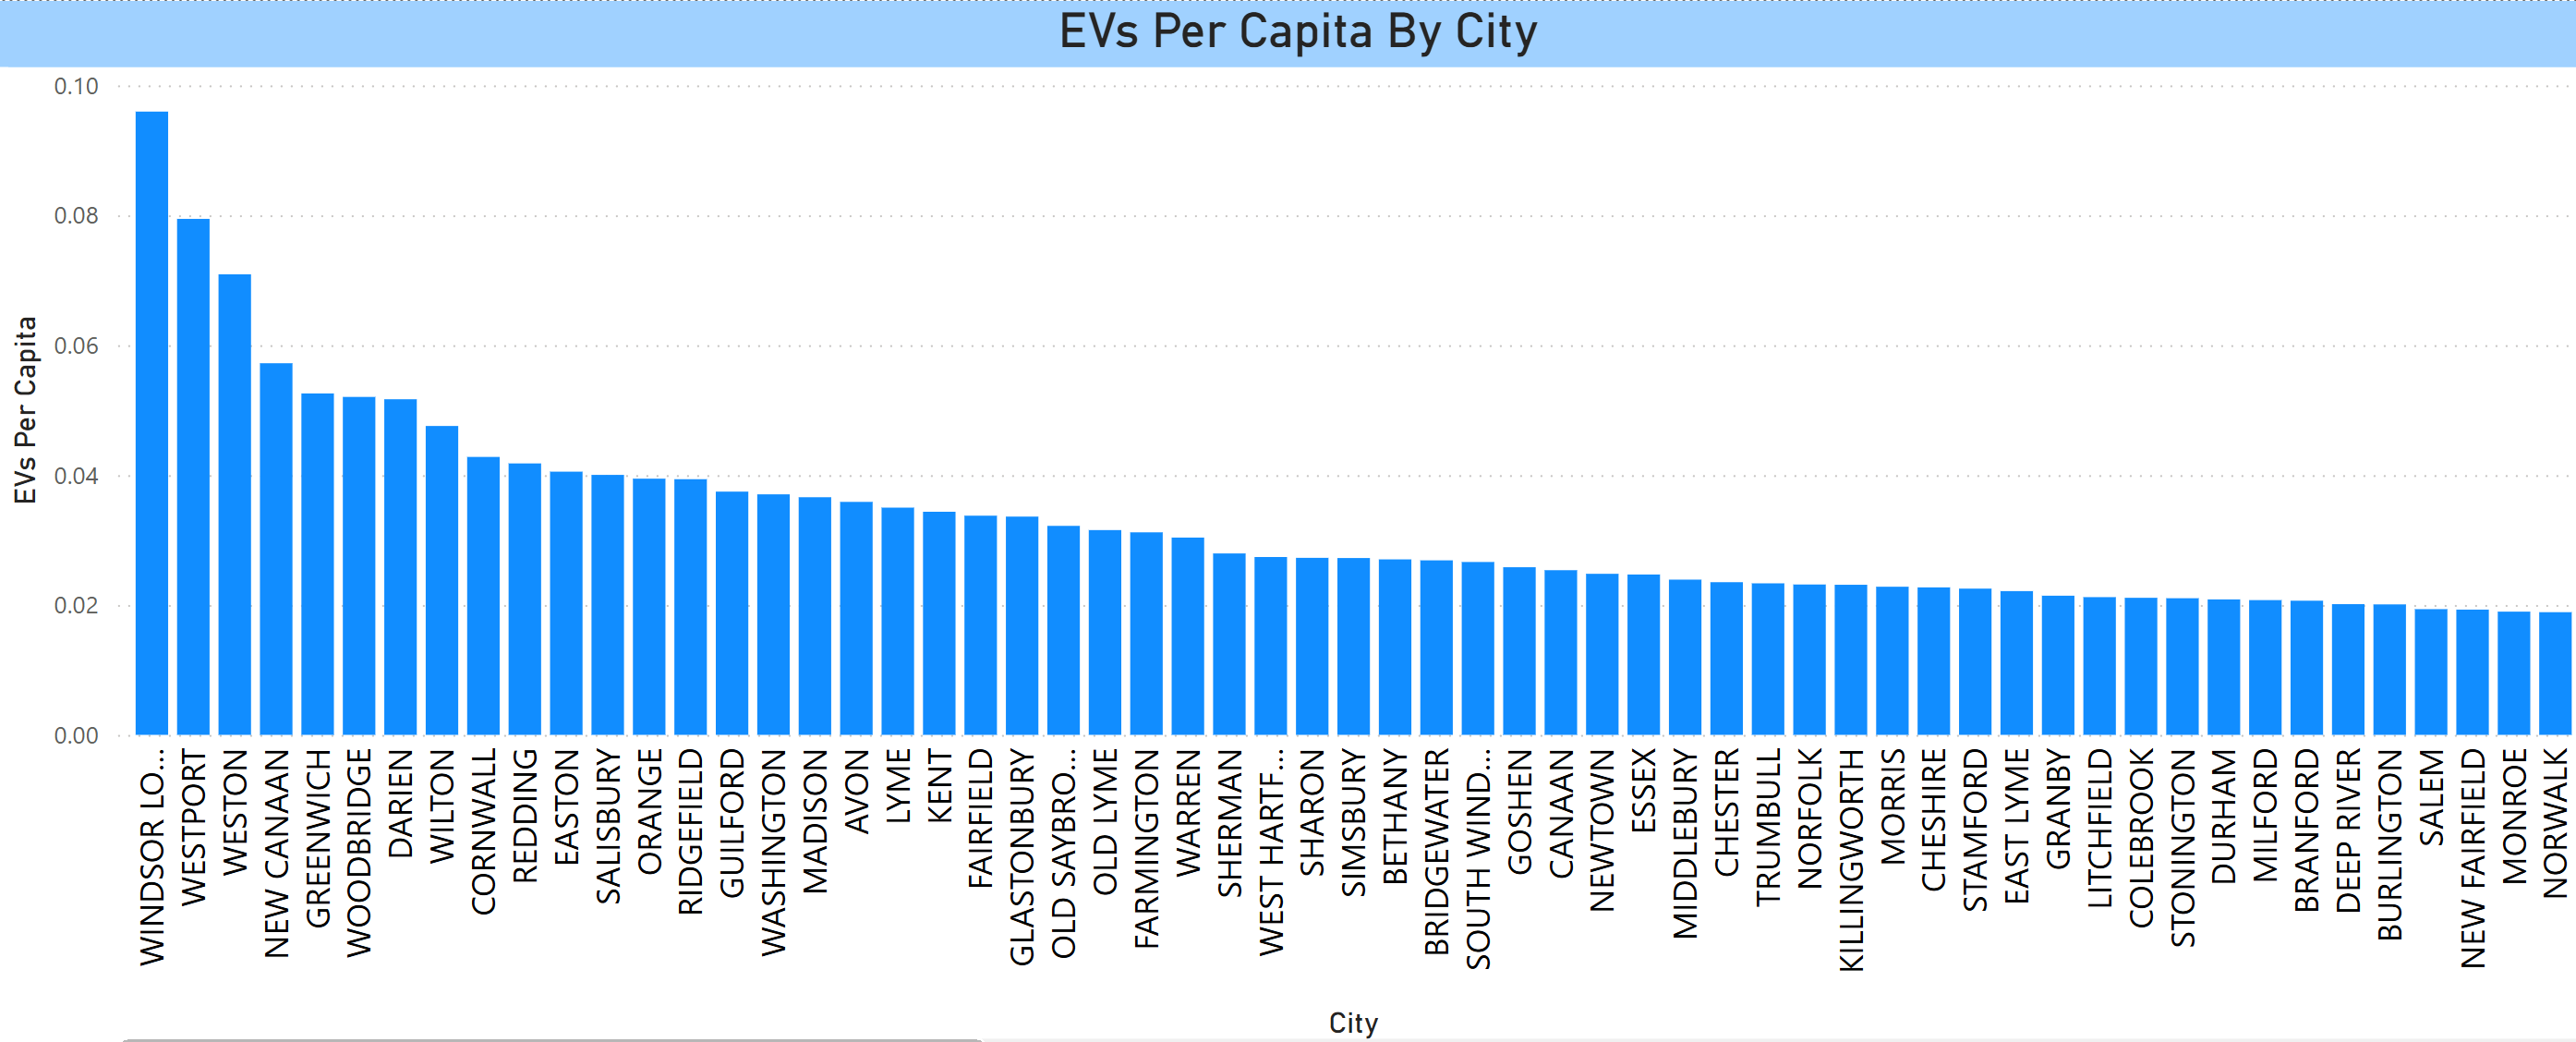
EVs Per Capita
The per capita rank follows the percentage rank pretty closely. There is a ringer in that the Windsor Locks numbers include rental vehicles from Bradley Airport. Otherwise, it is Westport, Weston, and New Canaan with the highest ratios as in prior years.
As mentioned earlier, if anyone would like data for a specific city, please contact the EV Club.