EVs by City and County
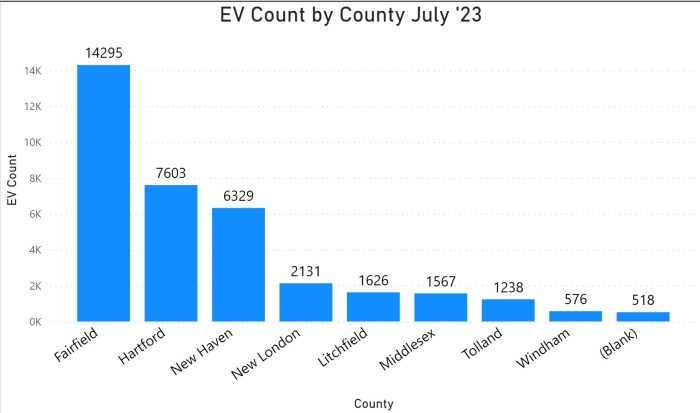
Notes – There are differences every time we receive a file. In this case, the data do not include electric motorcycles and the handful of fuel-cell vehicles, which is different than in the past. Also, importantly for this post, there are 518 vehicles for which there is no geo record. That is why one of the columns in the bar charts is labeled “(Blank).”
Map
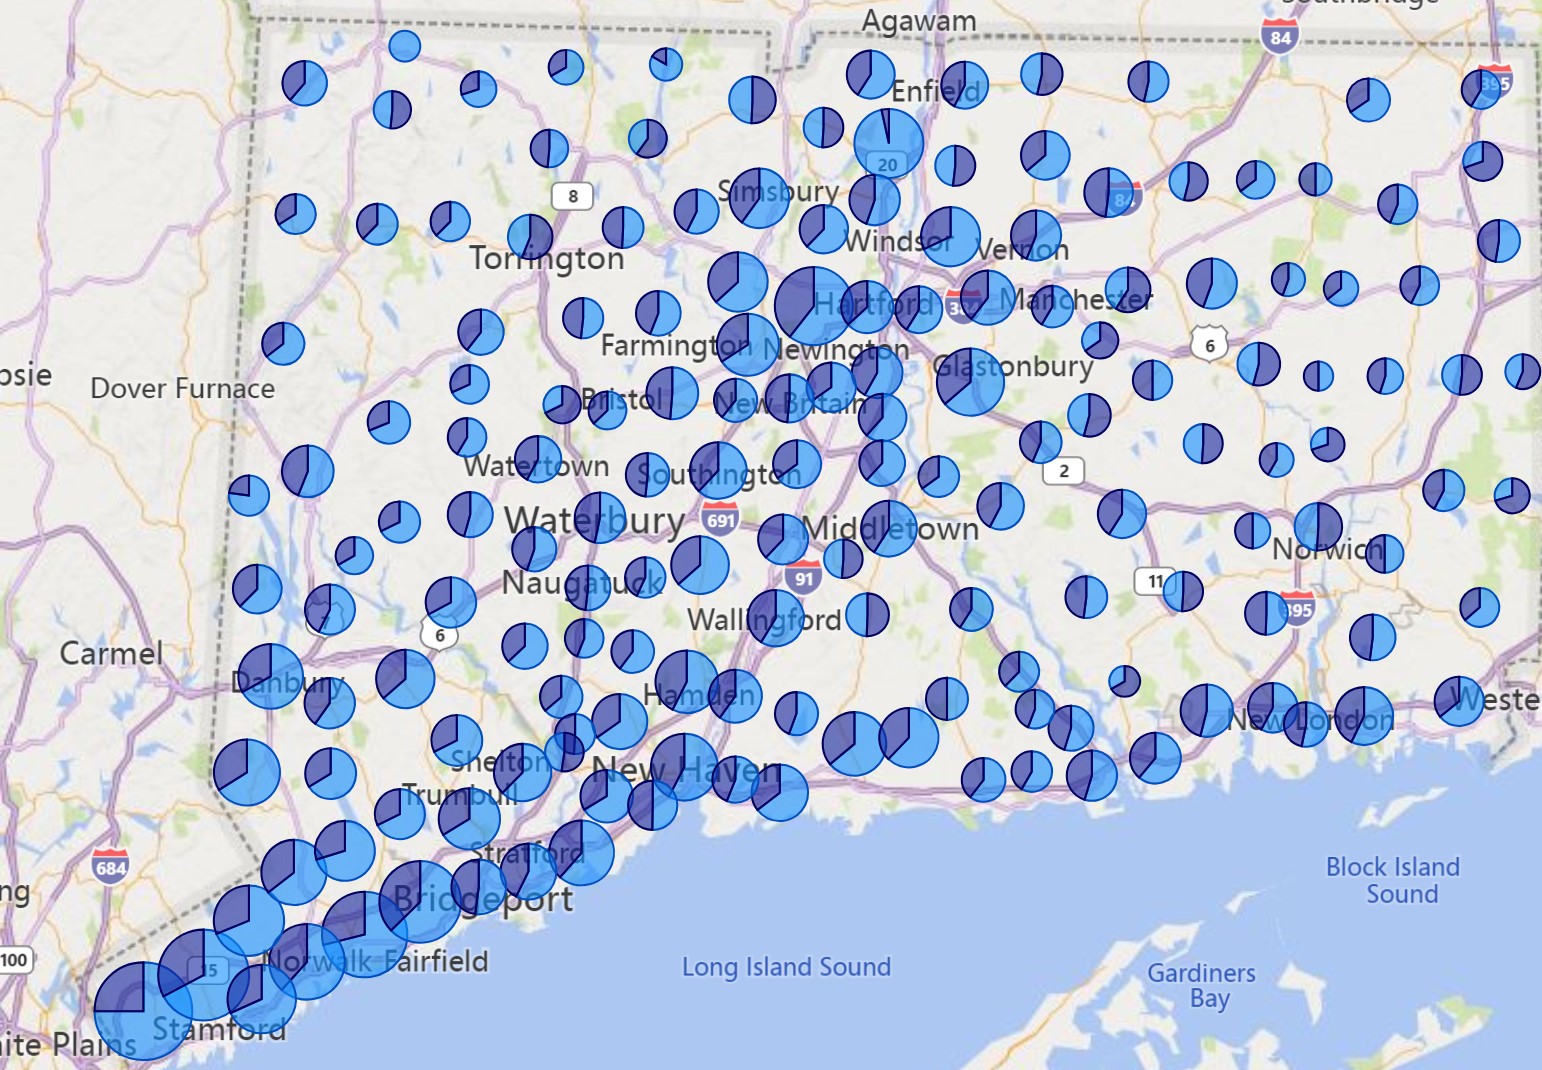
In the map at the top of the post, each bubble is a city, the size of the bubble reflects the number of registered EVs in that city, and the shades of color within the bubble depict the proportion of battery electric vehicles (light blue) and plug-in hybrid vehicles (dark blue).
County
Fairfield County remains the EV epicenter with 40% of registered EVs. Hartford and New Haven County follow with Hartford slightly higher.
City
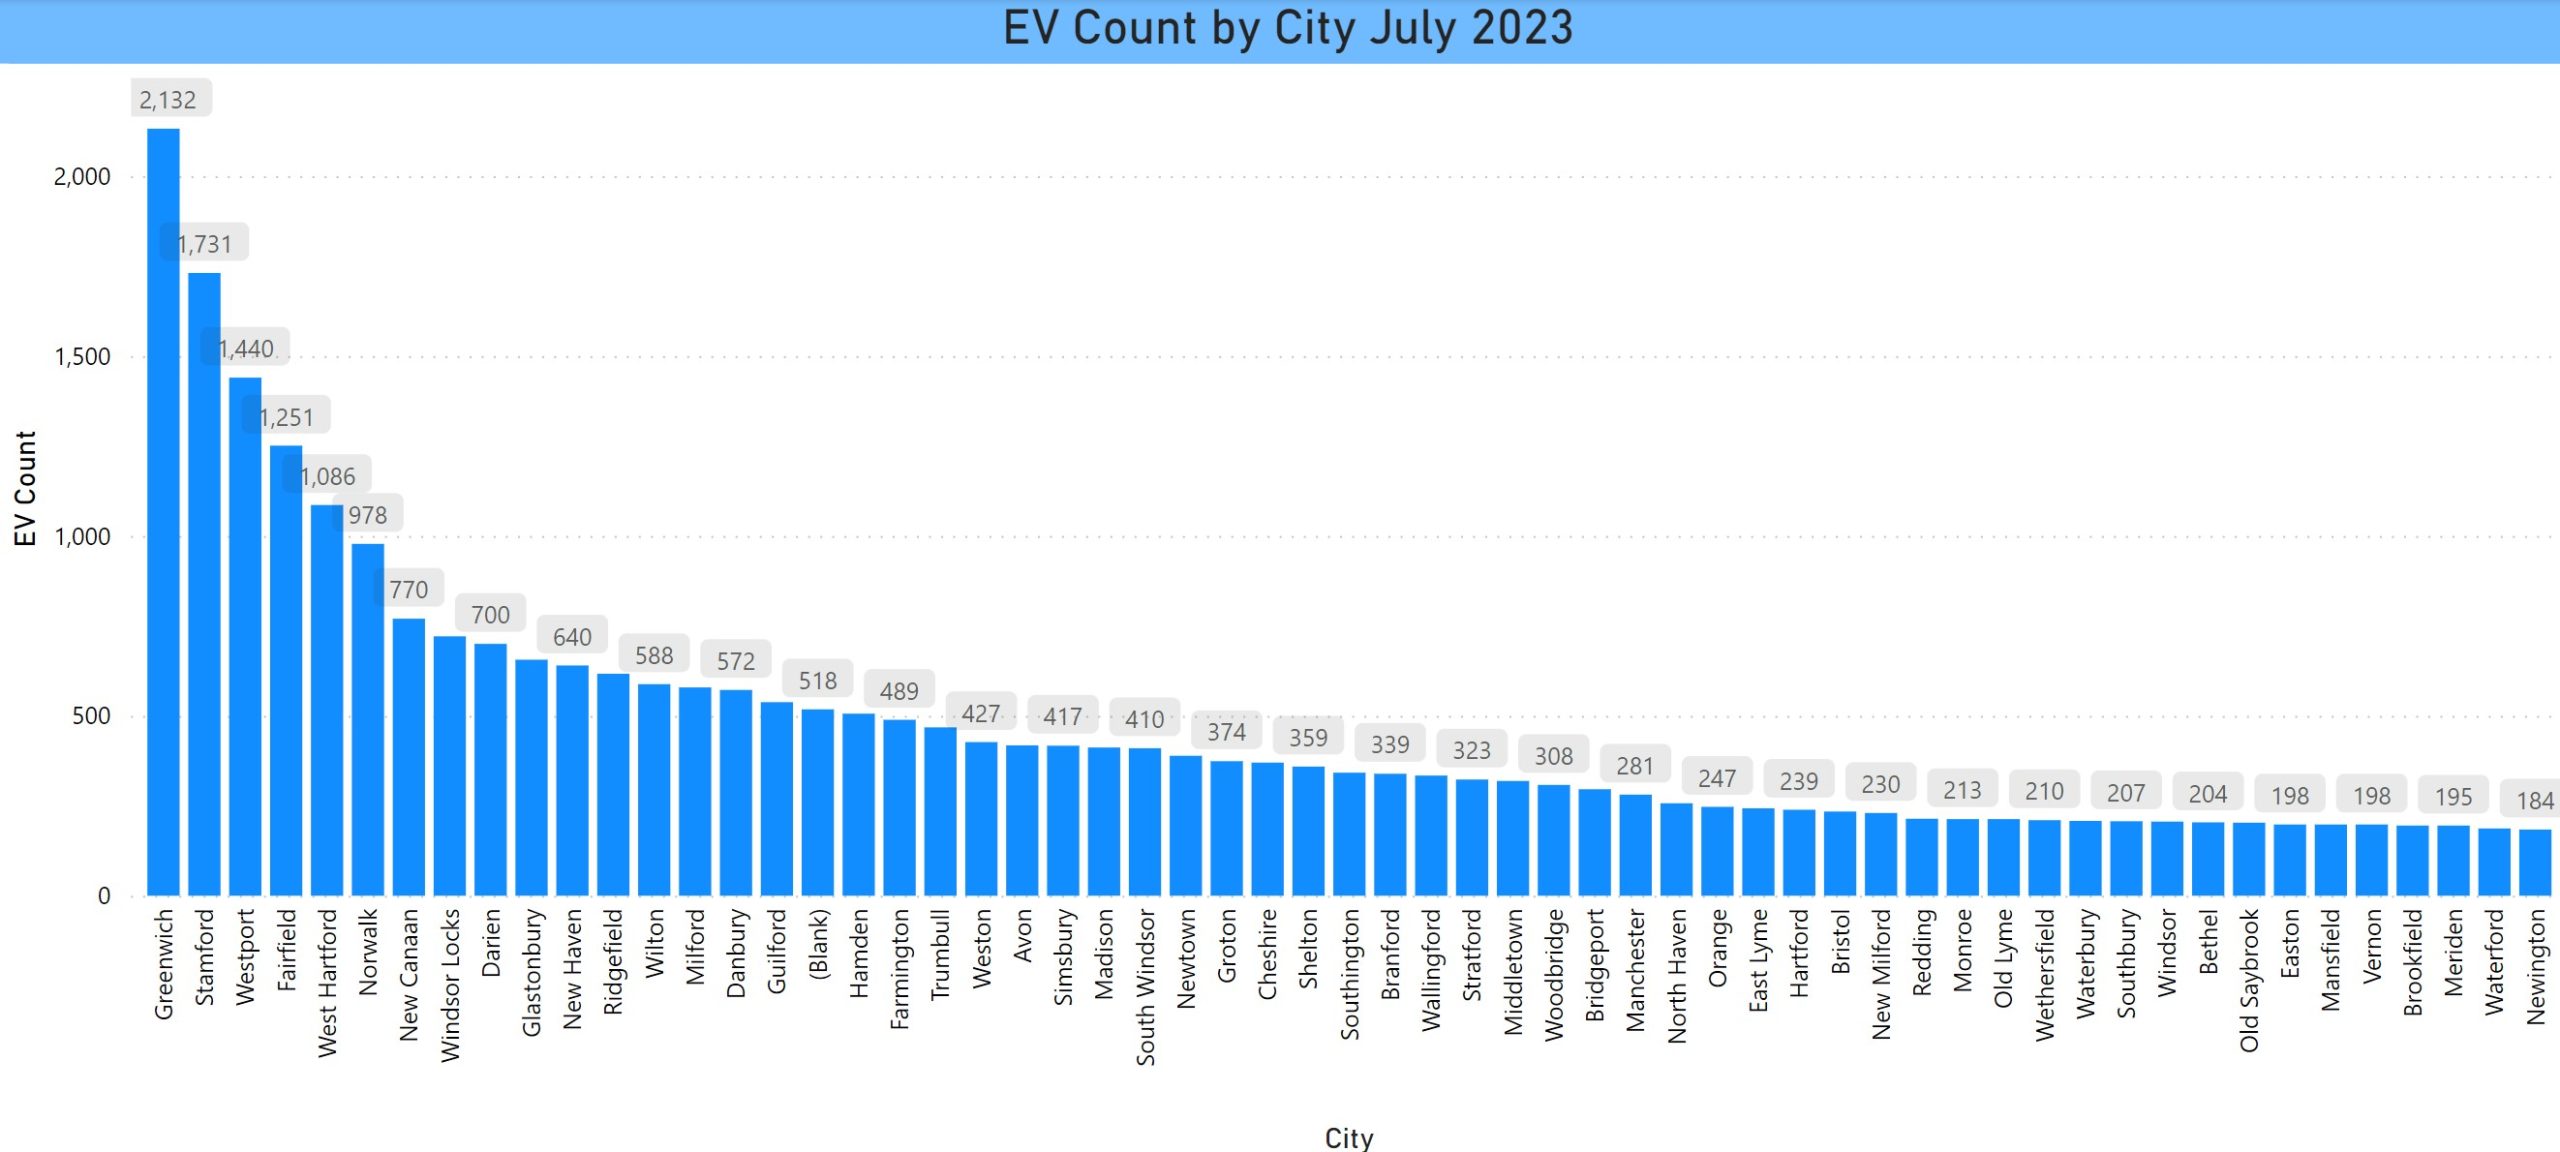
The top cities remain the same, except that Windsor Locks increased a lot to rank number 8. There is not enough room to display all of the cities or all of the data labels. If anyone would like to know the number for a particular city, please reach out to the EV Club.
EV Count Trend by City
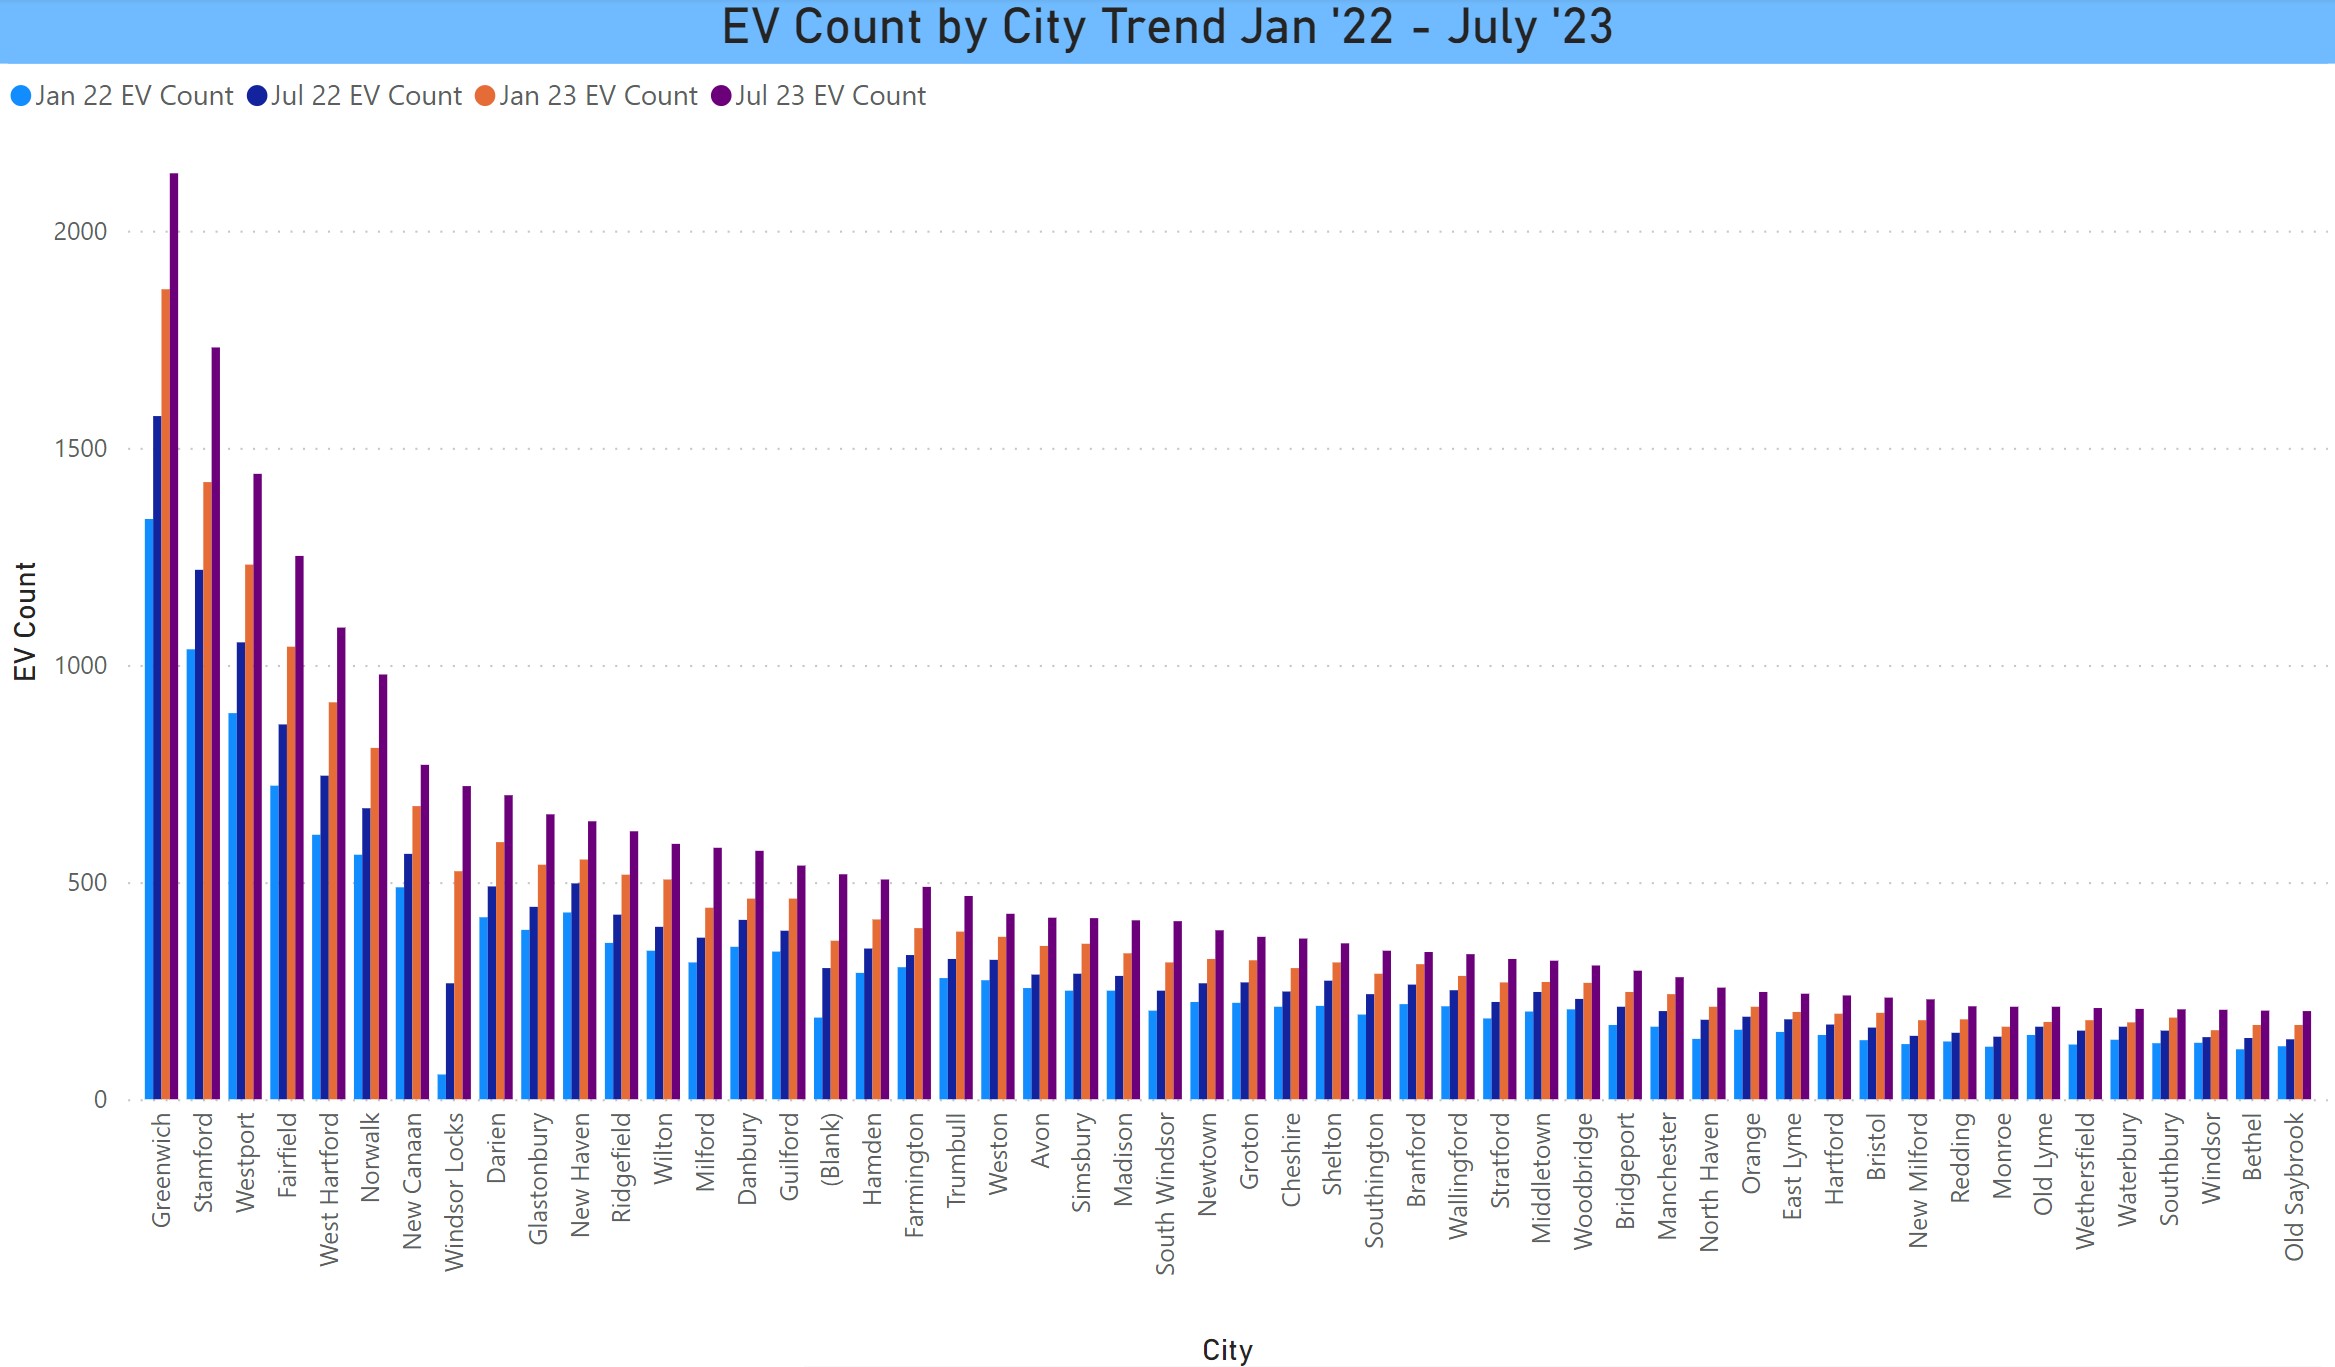
This is the trend for each city in 6-month intervals from January 2022 through July 2023.
Per Capita
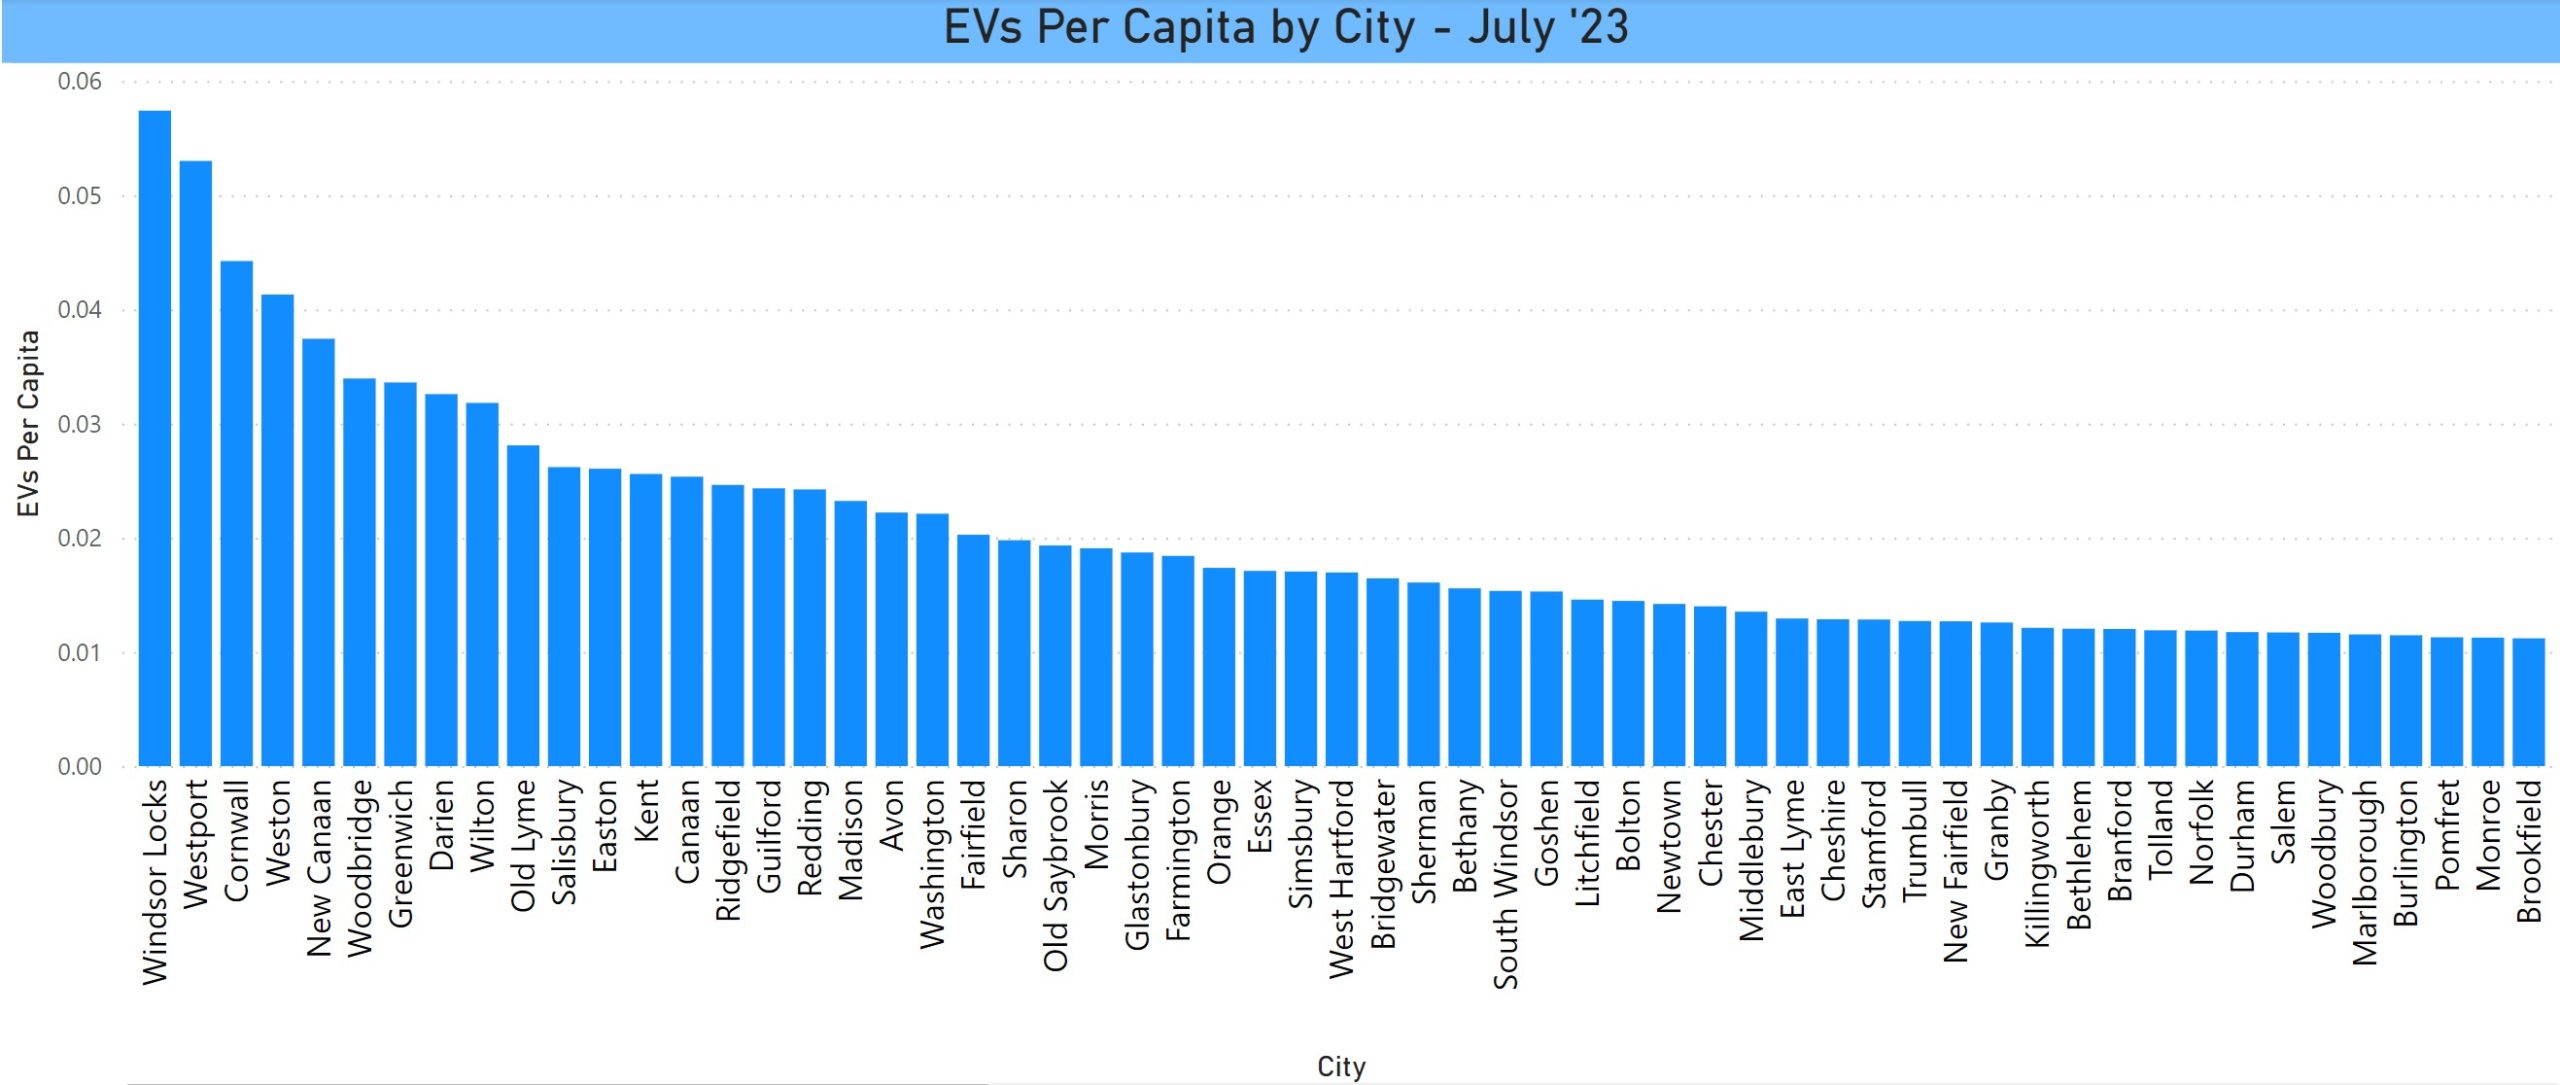
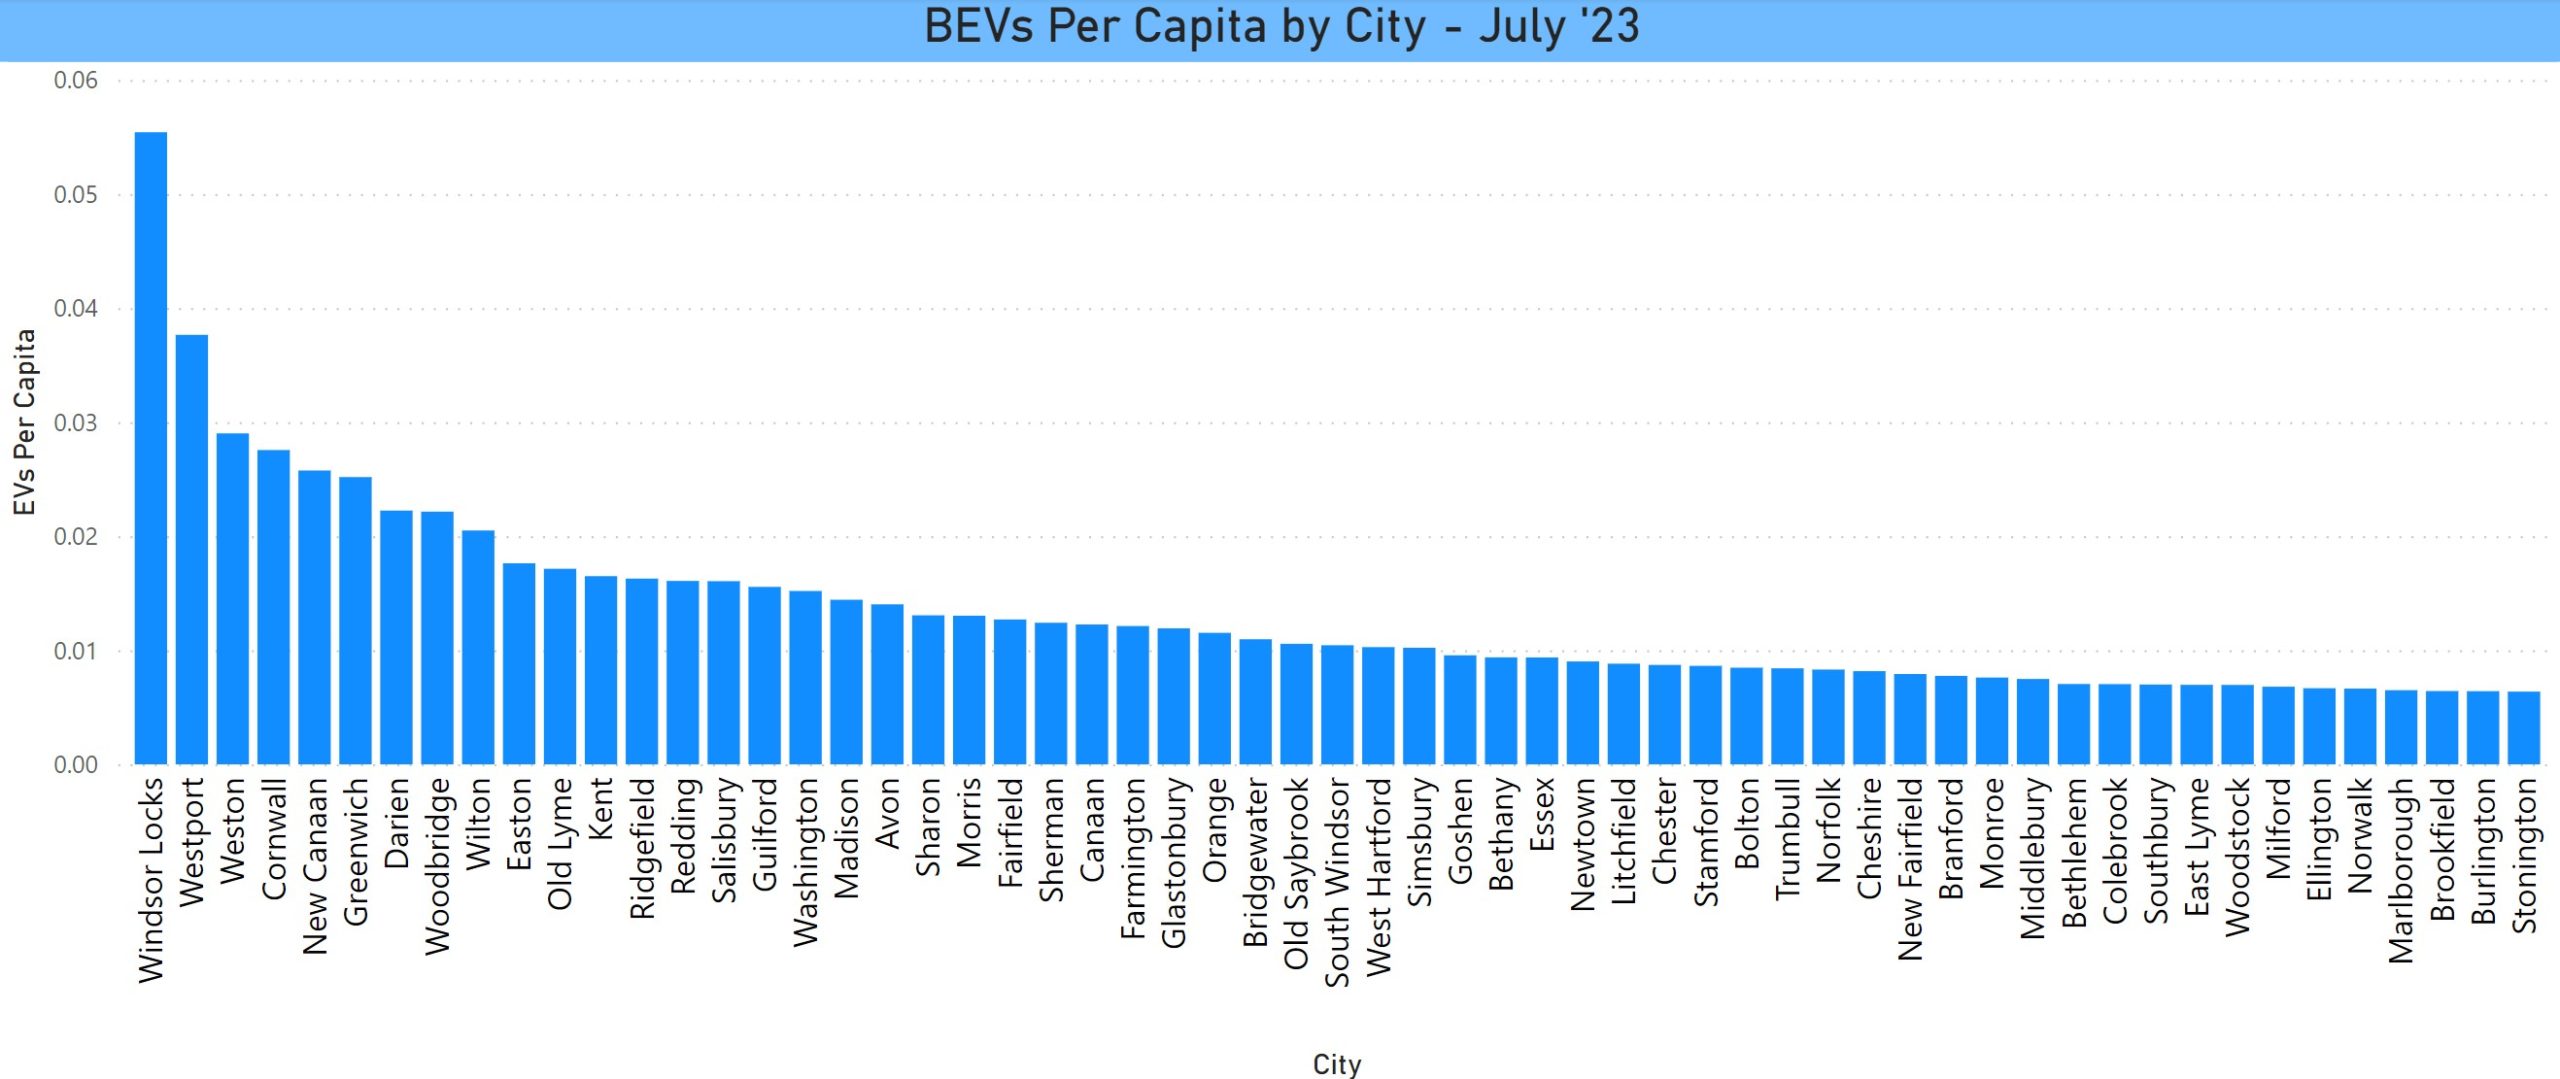
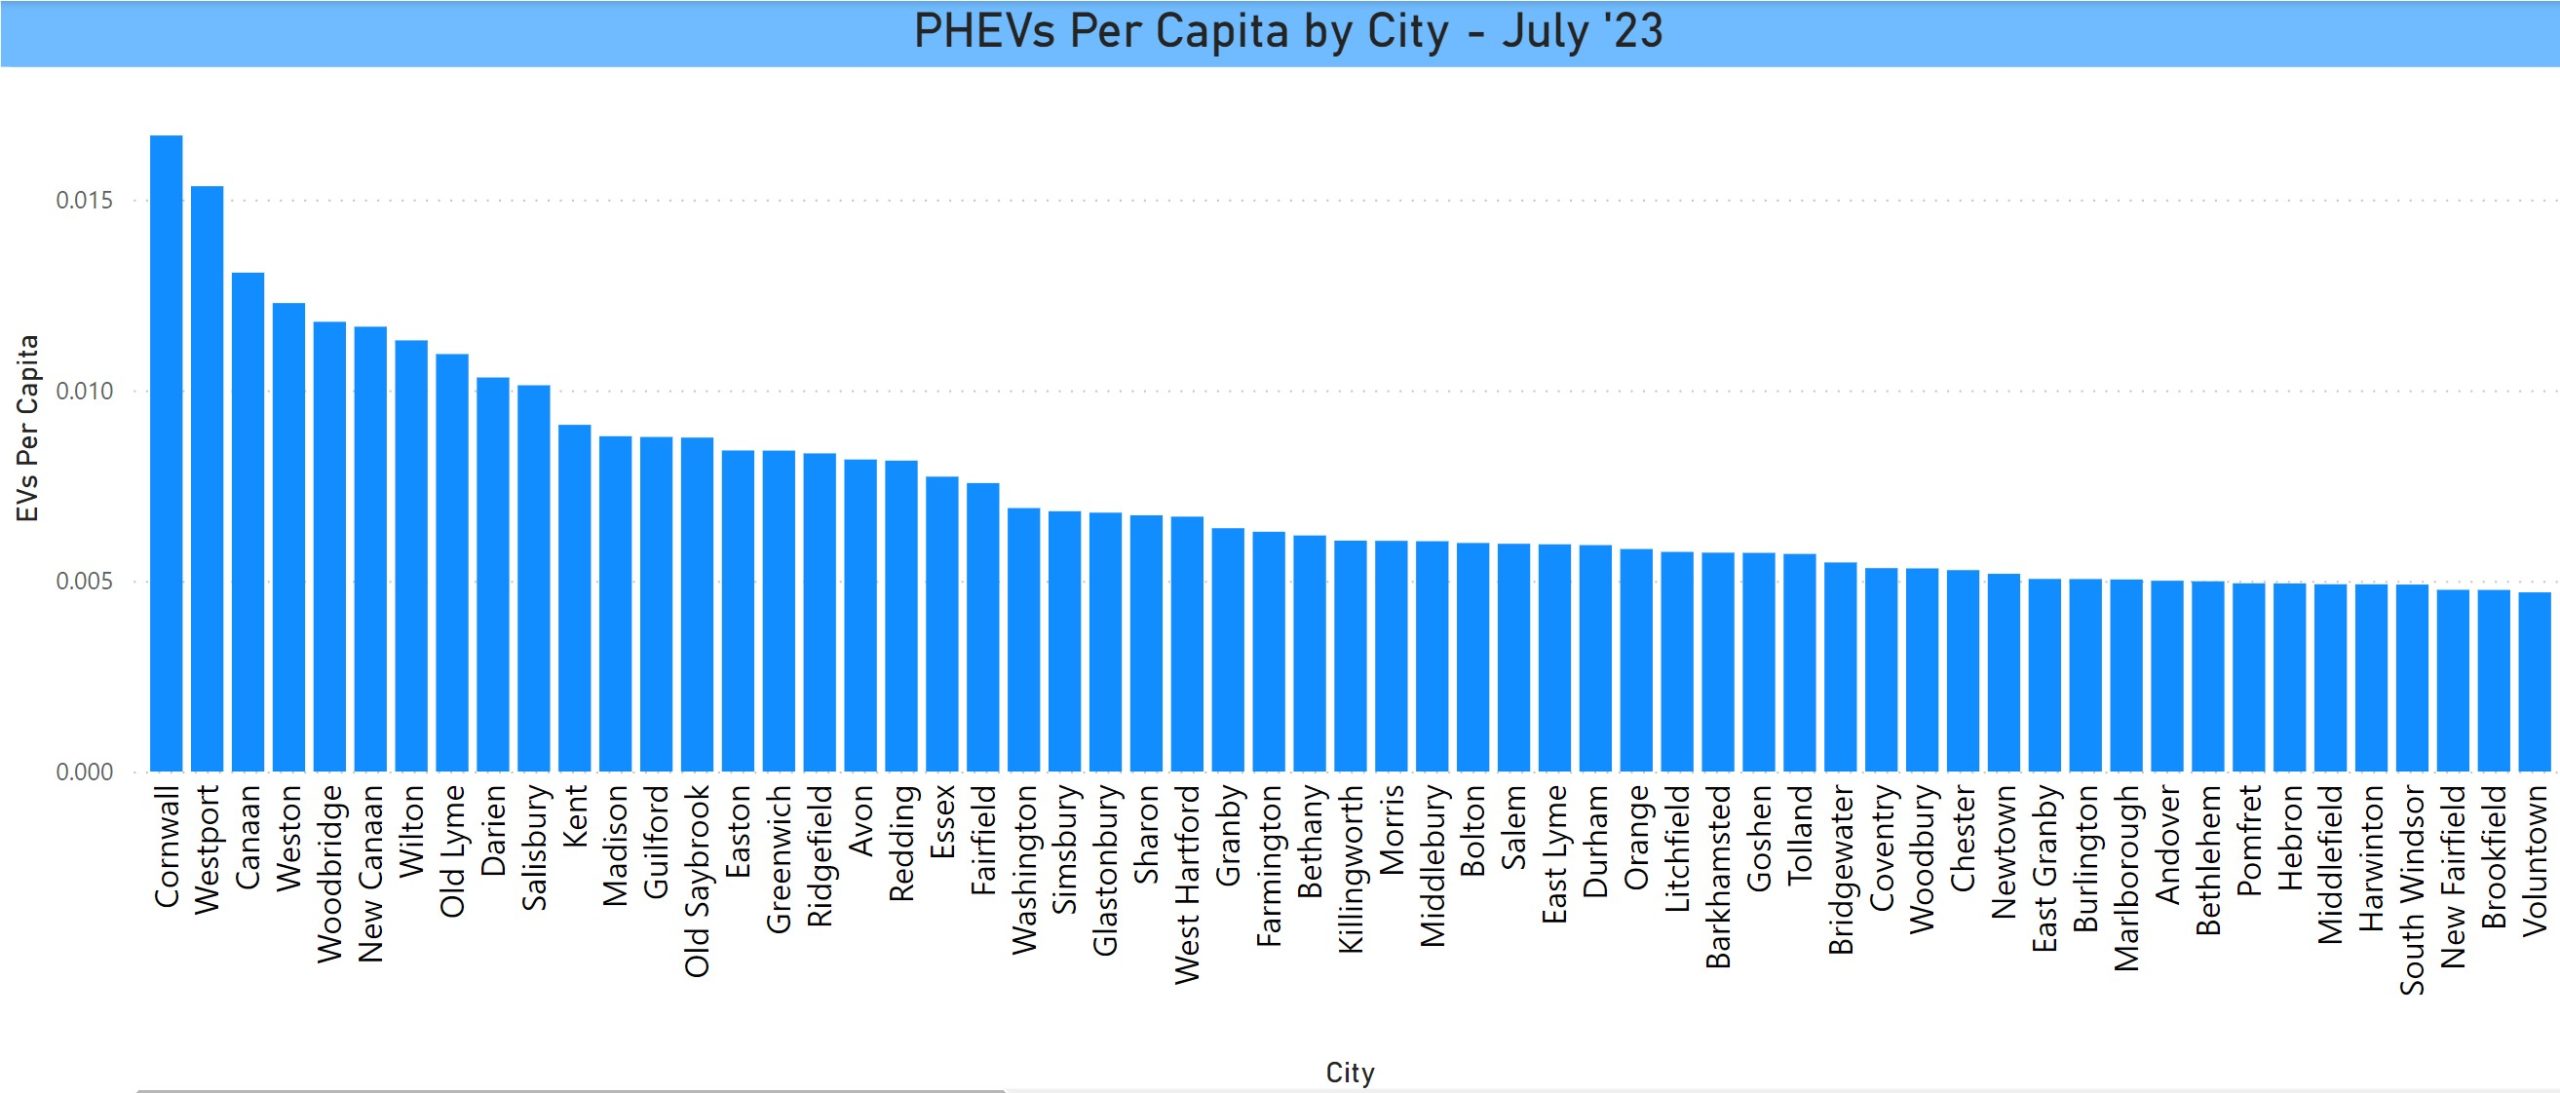
There is a change in the per capita rankings with Westport slipping to second, behind the smaller city of Windsor Locks, after being the leader since we started tracking these stats 7 years ago. Smaller cities dominate this ranking.
These are the per capita chart filtered for BEVs and PHEVs:
EV Count by Make within City
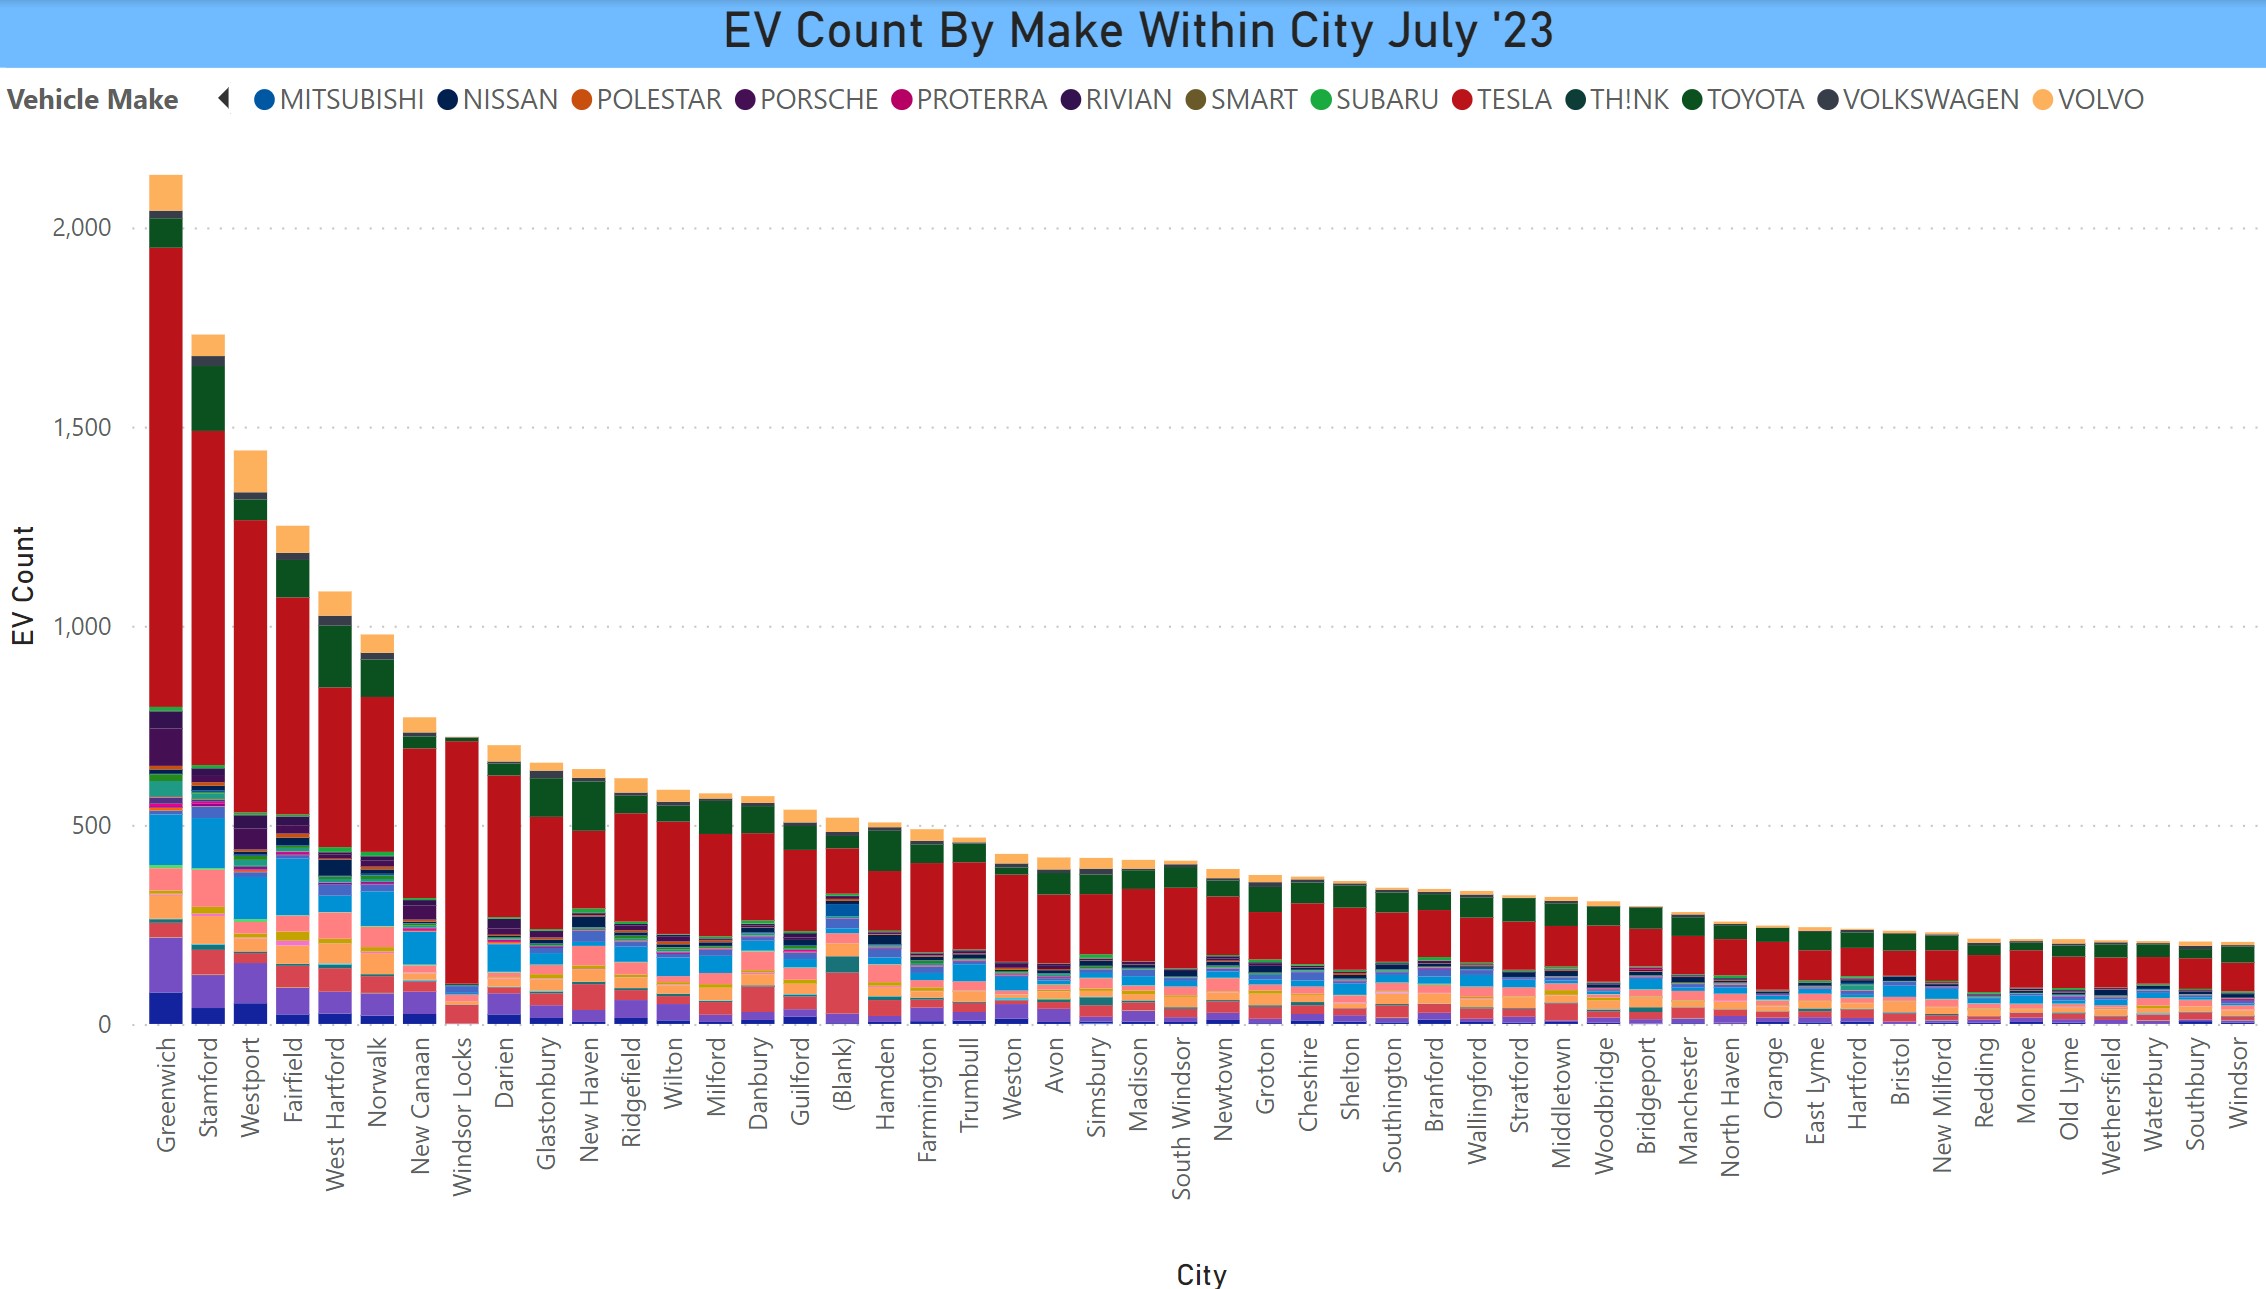
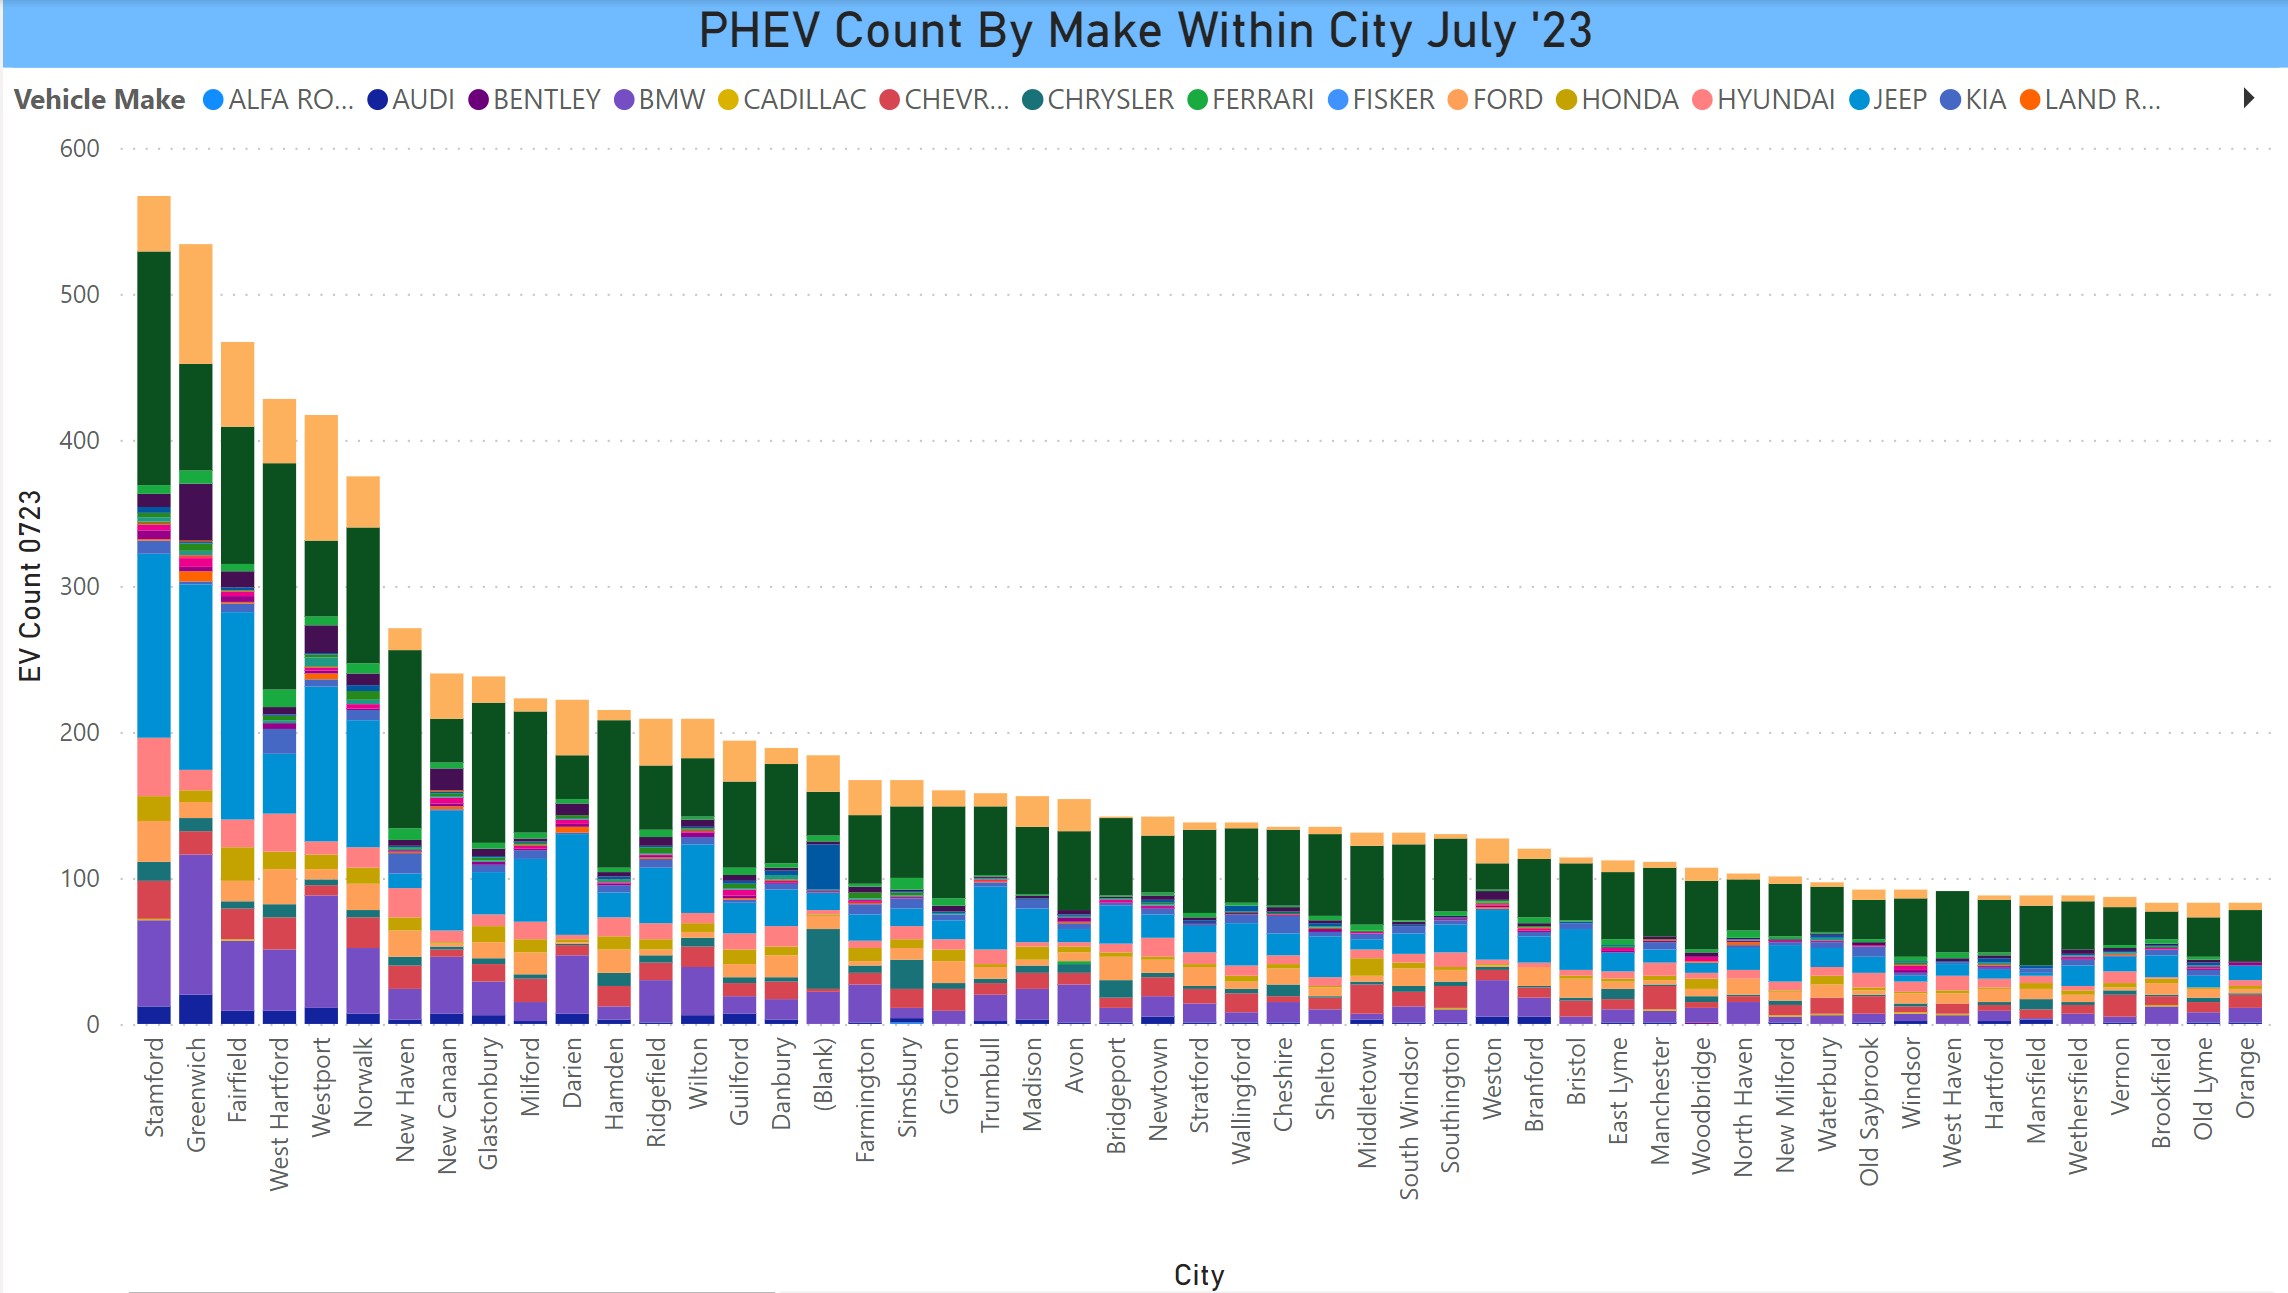
We are again able to track this. It is a dense chart that is complicated to see in a screen shot. At least it is colorful! Again, space is a limitation, both in the number of cities that can be displayed as well as the number of makes in the legend. The large red part of the bar is obviously Tesla. If anyone is looking for specific information, let us know. The chart itself displays some of the makes, but above the chart is all of the makes/colors.


![]()
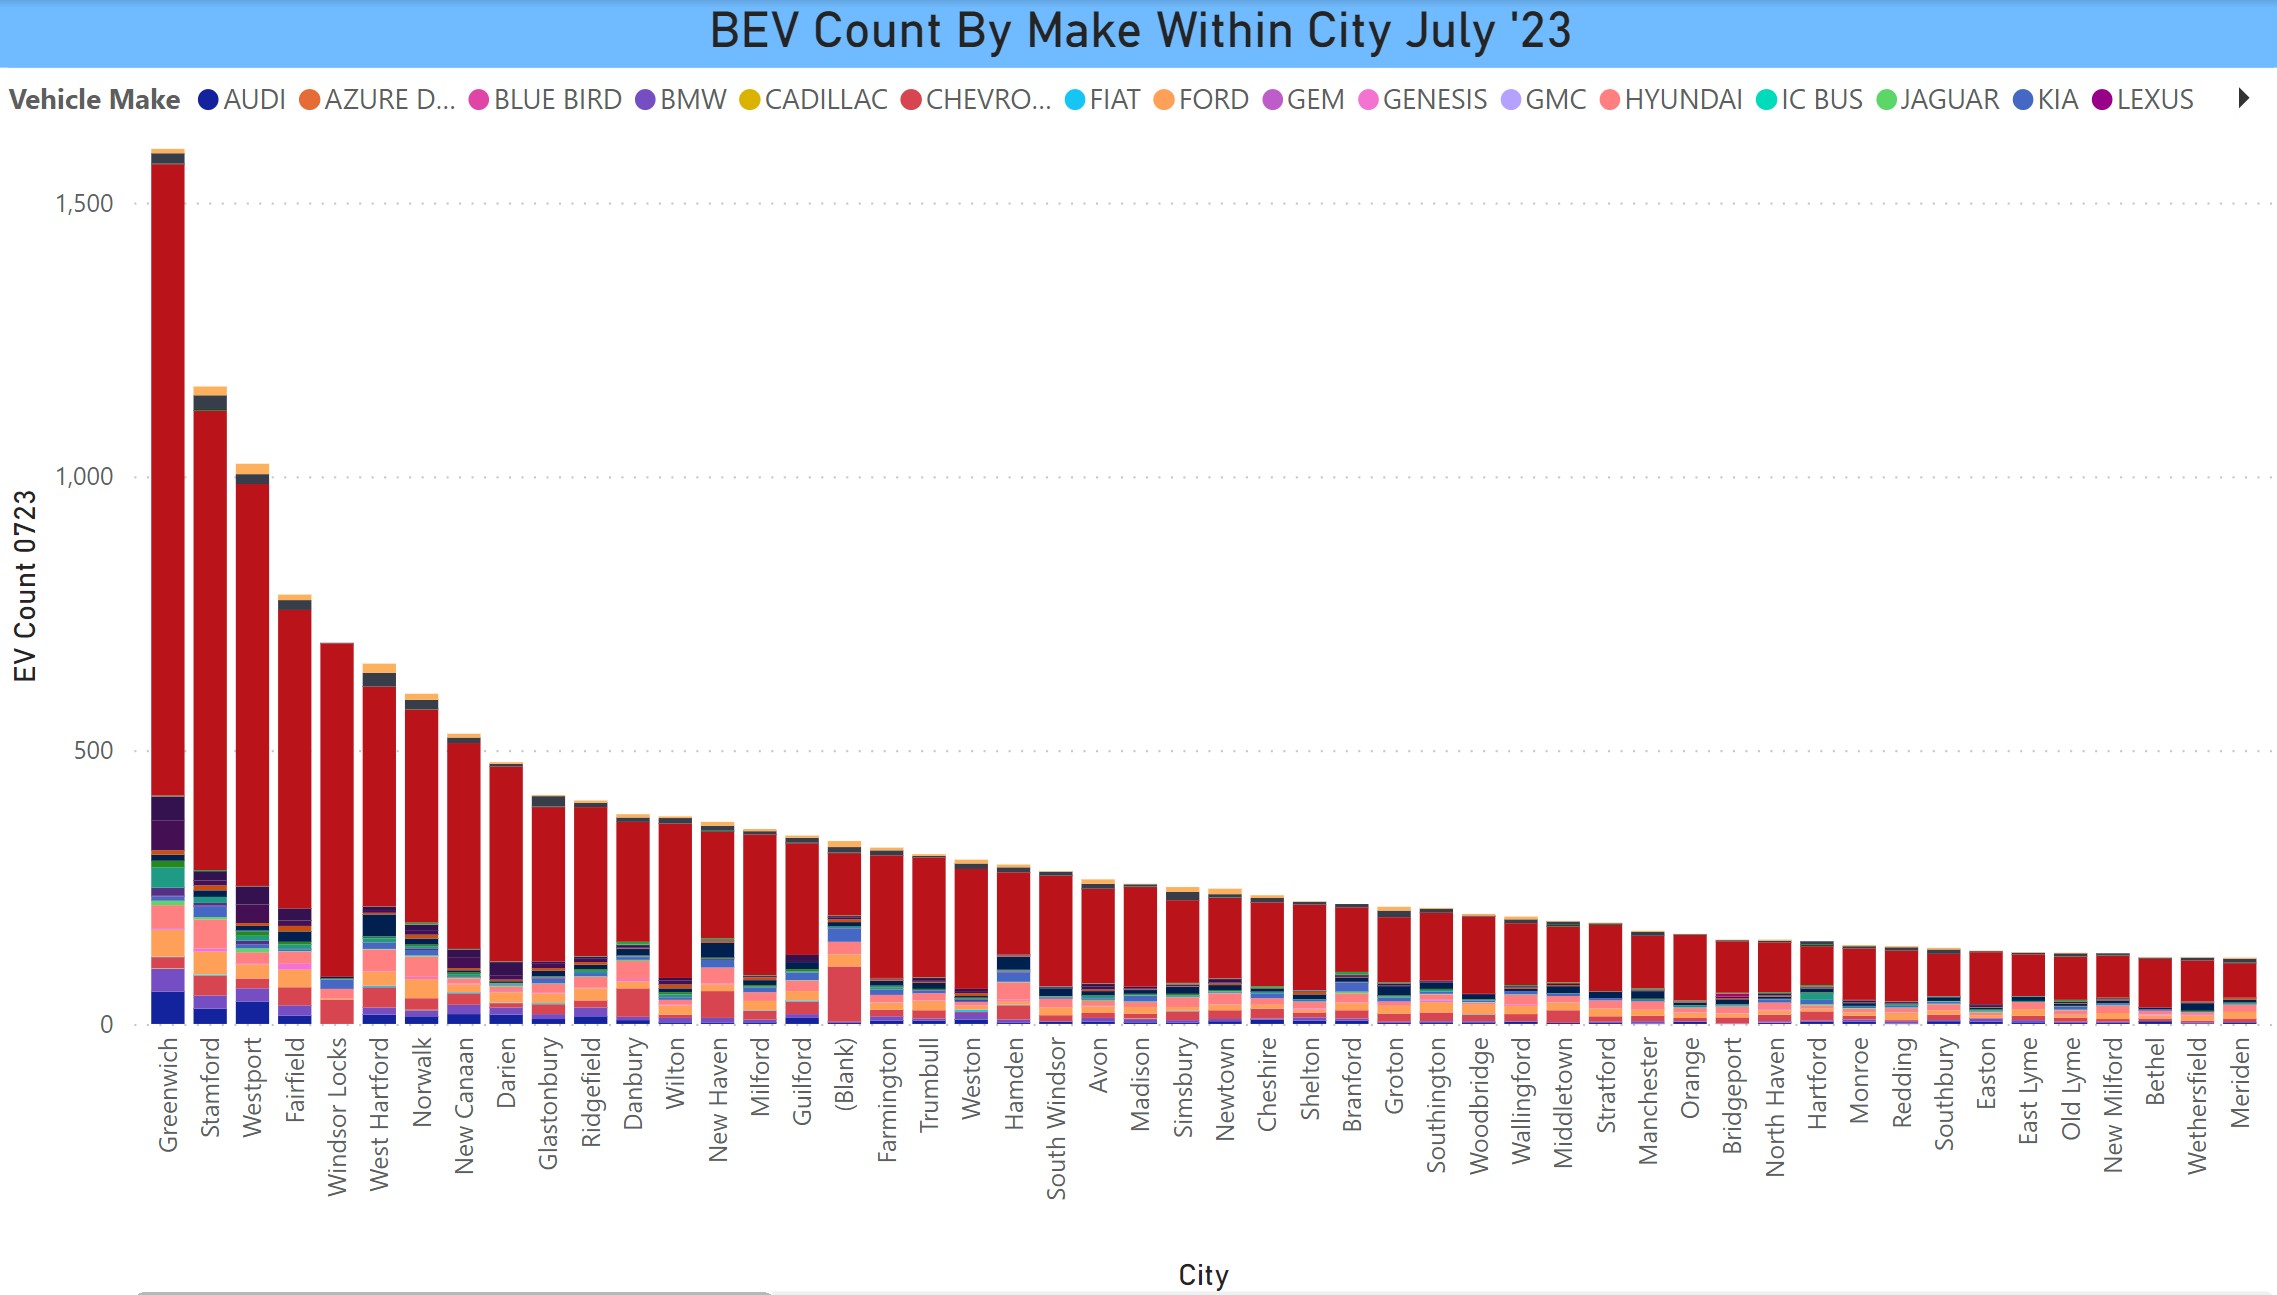
Below are two variations on the above chart – BEV by make within city and PHEV by make within city. It tracks more or less socio-economically with the BEV-heavy cities being the more affluent towns.

Please disregard the ask above for market share
https://afdc.energy.gov/transatlas/#/?view=percent&state=NY
This chart covers that variation, but the city by city data that you have here is not covered in this site at all. Super valuable insights.
Thank you for all the work and great data insights.
One trending topic on the national level is the % of new reg that are BEV or PHEV as compared to the total. I was curious if the top towns are getting to new vehicle EV adoption of >20% as with CA.
This site sometimes has that type of data but I didn’t see the market share data or total on-the-road proportion. https://afdc.energy.gov/data/10962
I have new EV registrations by town, not yet published, and EVs as a % of total vehicles by town, also not yet published, but I don’t have a denominator for all newly registered vehicles. Other items will be published within the next week or so.
Will you be preparing an EV interactive dashboard for July 2023?
Thanks for all the work.
The dashboard is now posted! https://evclubct.com/interactive-ev-dashboard-july-2023/