
Registered EVs by City and Top Cities
The mid-year update of registration counts have been released and this post highlights some data about the number of EVs registered by city.
A reminder – this is net registrations, a snapshot at a point in time. Vehicles are not double-counted. It includes all EVs, not just new vehicle sales, but including those acquired used, people moving into the state who already own an EV, and vehicle turnover. The definition of EV includes BEV, PHEV, fuel-cell (though there are only 3 of them), and BEMC (electric motorcycle). The reason for this definition is that it is the definition the state uses when setting its EV adoption goals.
The total number of registered EVs is 67,656 as of July 1. 43,141 are BEV, 24,195 are PHEV, 3 are FCEV, and 317 are BEMC.
In the map chart at the top of the post, the bubble size corresponds to the number of registered EVs for a given city. We are still working with the first data release, which is at a summarized level, so we are not able to parse the different drive trains at this time.
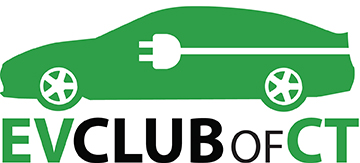
These are the top cities in terms of registered EVs. The chart shows cities with greater than 700 registered EVs. This ranking doesn’t radically change year to year, though Stamford is catching up to Greenwich.
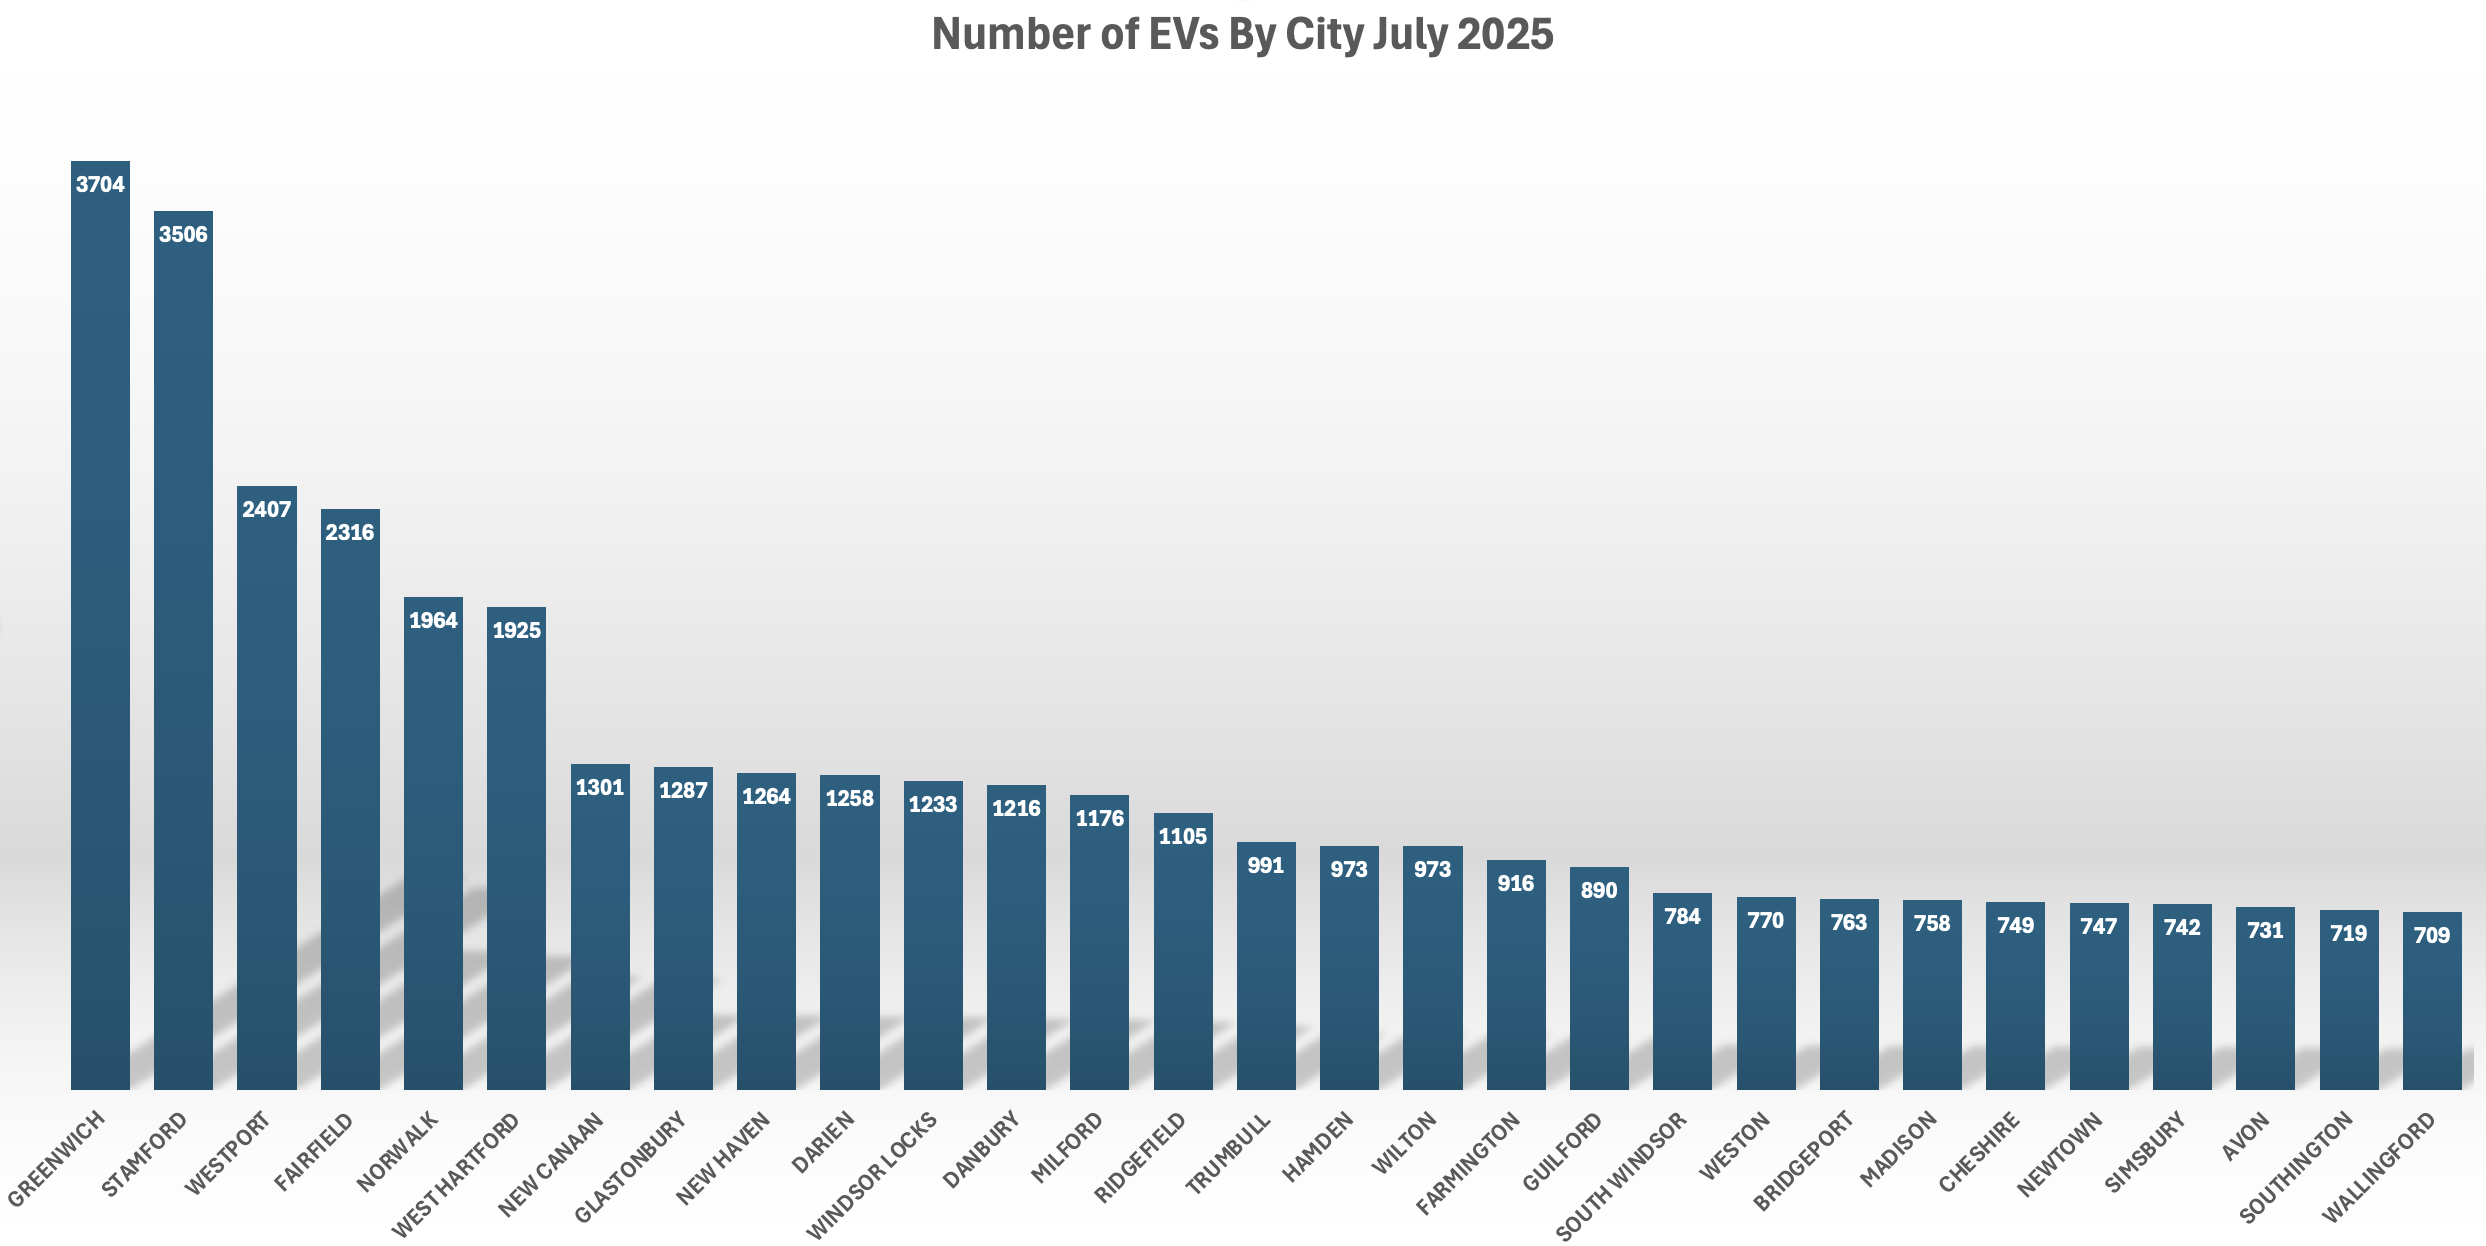
The count of EVs by city has somewhat of a bias toward larger cities, so we also look at EVs as a percentage of total passenger vehicles. Little Ansonia, with only 135 EVs tops the list on a percentage basis, surpassing perennial leaders Westport and Weston, making 3 cities that have achieved double-digit EV penetration.
Recent Trends by City
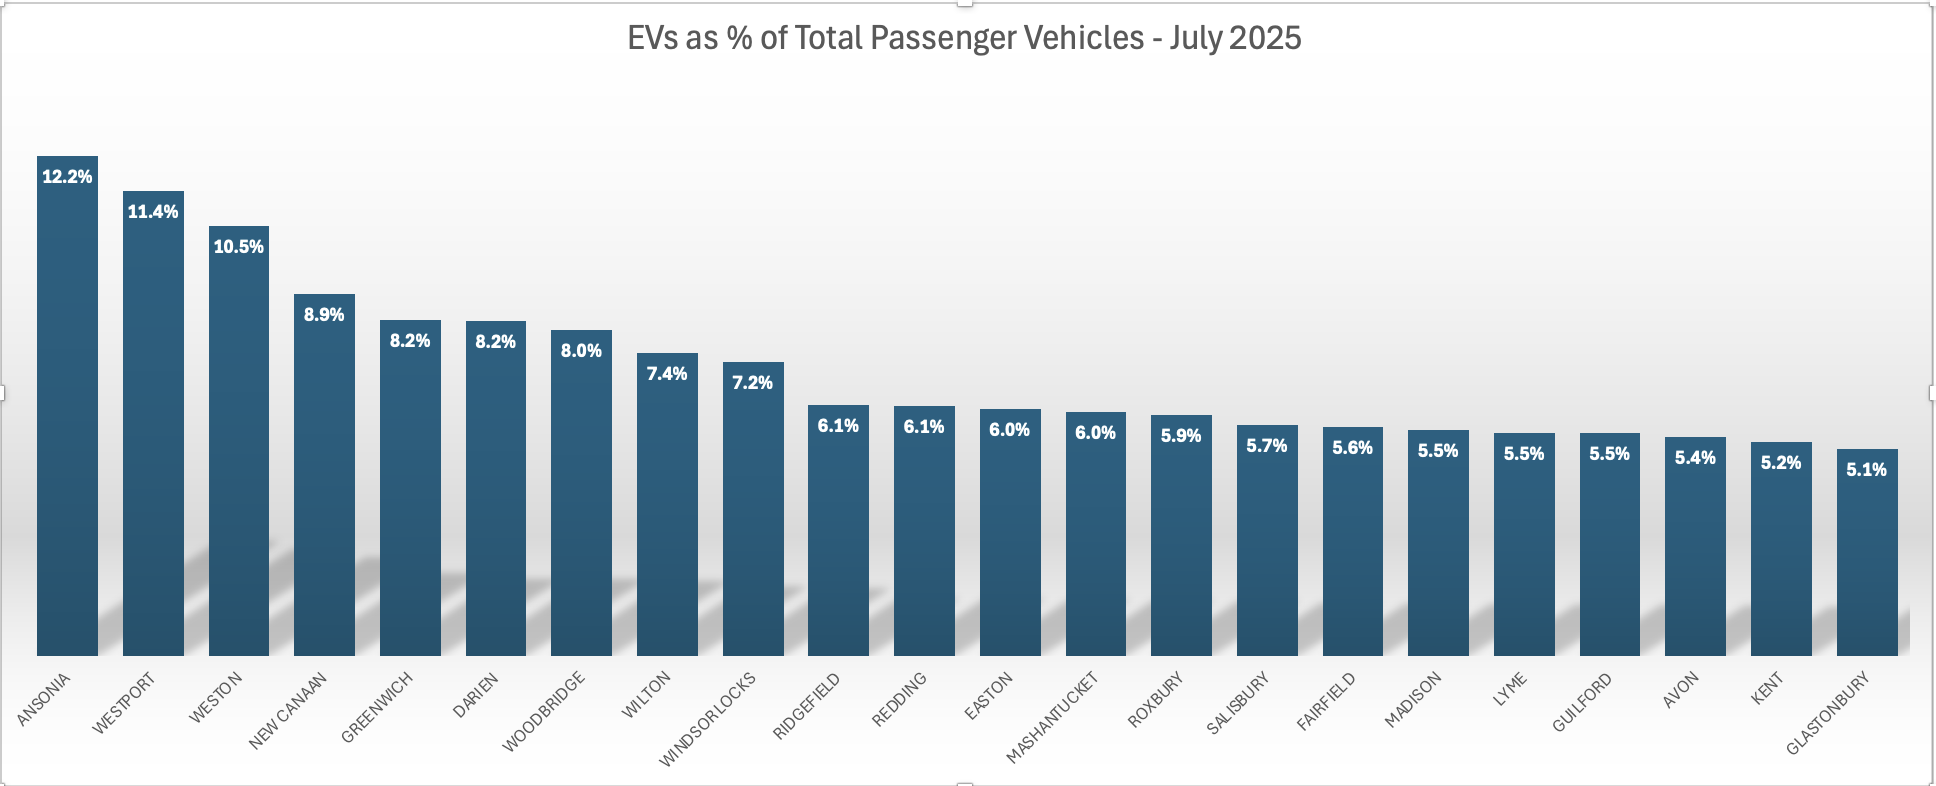
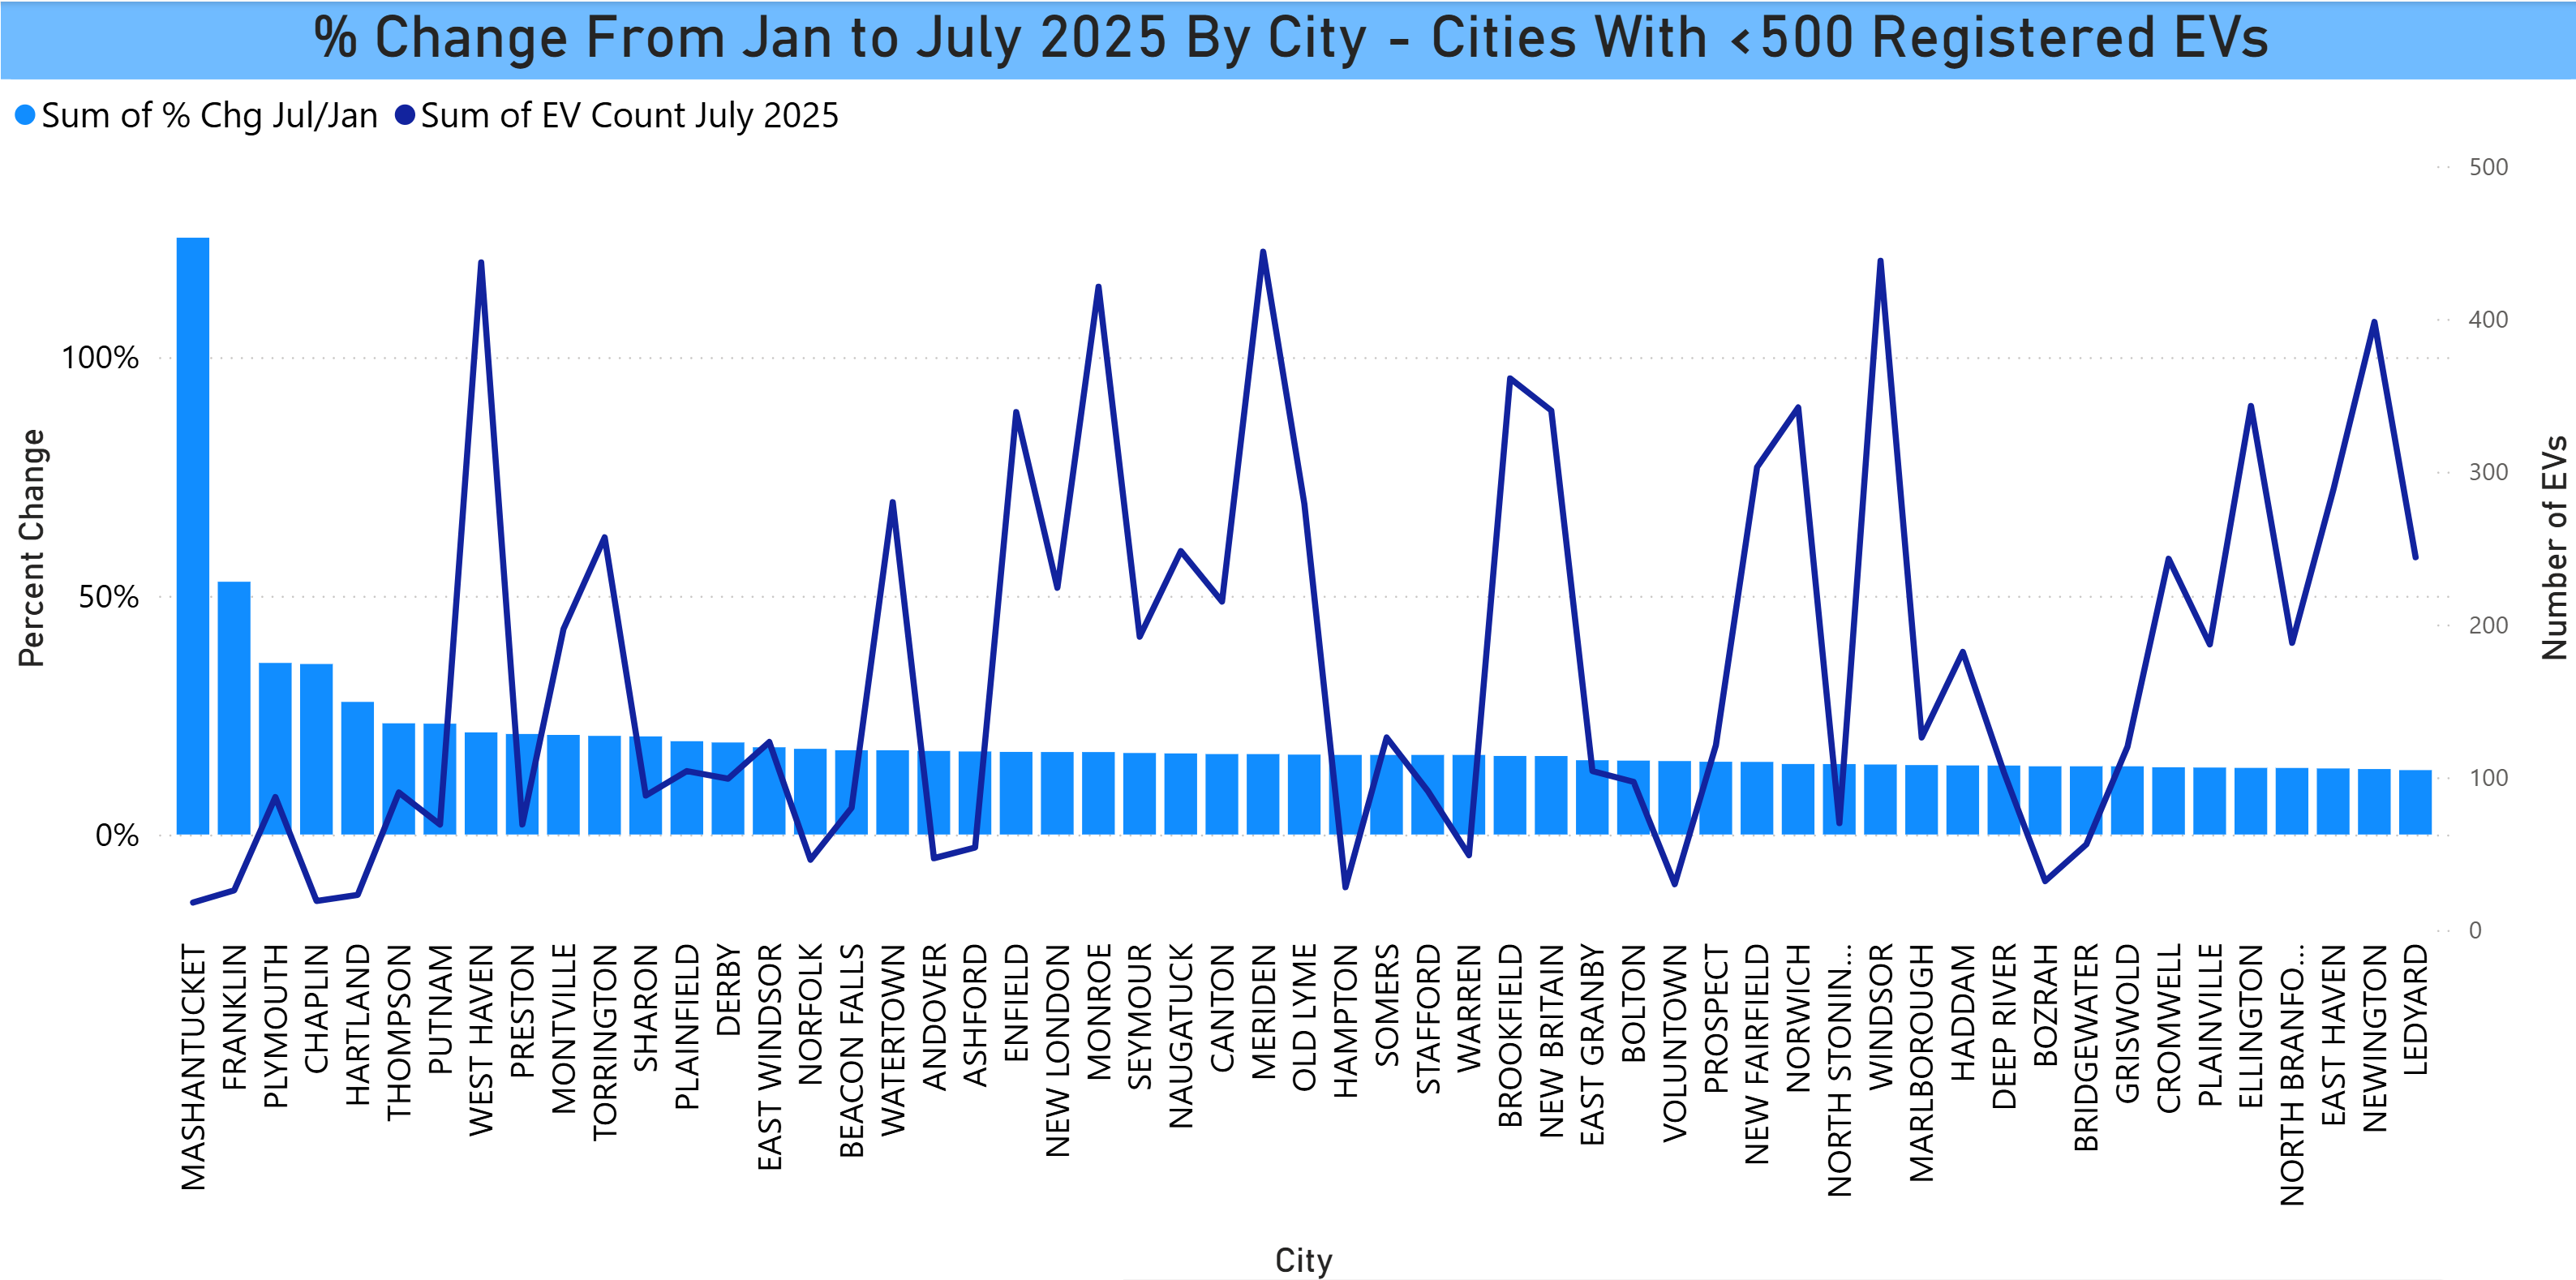
The two charts below look at the percentage increase of EVs from January to July of this year. Since a low base can drive a high percentage increase without translating to that many vehicles, the first chart is the increase among those cities with 500 or more EVs and the second is the cities with the largest increases among those with less than 500 EVs.
There was one city where there was a decrease, Orange, something of a surprise.
The bars are the percent change. The line is the number of registered EVs.
There is a limited amount of information that is able to be displayed in a static graphic. If you would like to know specific numbers for your city and it is not displayed here, please ask in comments or contact us at EVClubCT@gmail.com.
A reminder: We are accepting RSVPs for our test drive event in New Haven on September 28th. We have 5 makes of vehicles for which test drives will be available with the possibility of a couple of more being added.
Registration link: https://driveelectricmonth.org/event?eventid=4974
The event page, which is continuously updated is here.
Registration is free, but we do ask that you register as it helps us plan.