Interactive EV Dashboard – July 2019 Update
The Department of Motor Vehicles has released its semi-annual update of EV ownership in the State of Connecticut. The update is dated July 1. The DMV only publishes the total on its website. We have obtained a detailed file to analyze the profile of EV ownership in CT. This is a file of all light-vehicle EV registrations. It is not new vehicle sales. It includes both purchased and leased vehicles, whether acquired new or used. It reflects newly acquired vehicles, less any turnover. There were 2136 EVs registered in the first half of 2019, but with a turnover of 628 vehicles, the net increase is 1508.
There is no PII. We received make, model, model year, fuel type, and zip code. We added in census data for population by city and median household income by city. The zip code reflects where the vehicle is registered, which could, in some cases, be different than where it is garaged.
This blog post summarizes some of the highlights and uses screenshots, which are not interactive. This link will take you to the browser version of the dashboard, which has the interactivity. Note: pagination is at the bottom of each page. The dashboard also lives on PBI.com, which we can link you to upon request.
Feel free to contact the club with any questions!
Growth
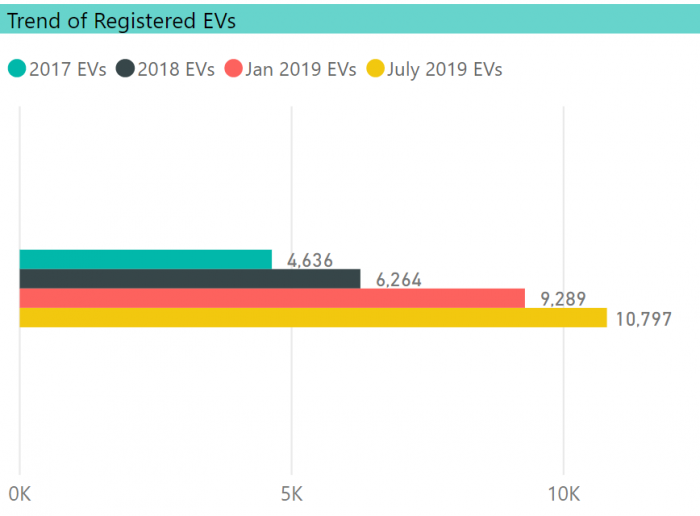
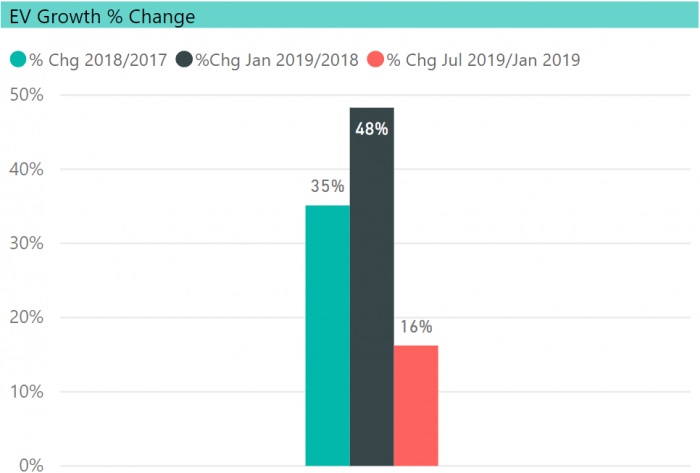
There are now 10,797 EVs registered in CT, an increase of 16% from Jan 2019. This is not a great number. It paces below the CAGR of about 40% that is necessary (based on the Jan. 1 number) to meet the goals outlined in the ZEV Multistate Action Plan. (Granted, this slower growth is occurring against a backdrop of slowing automobile sales generally.)
Fuel Type
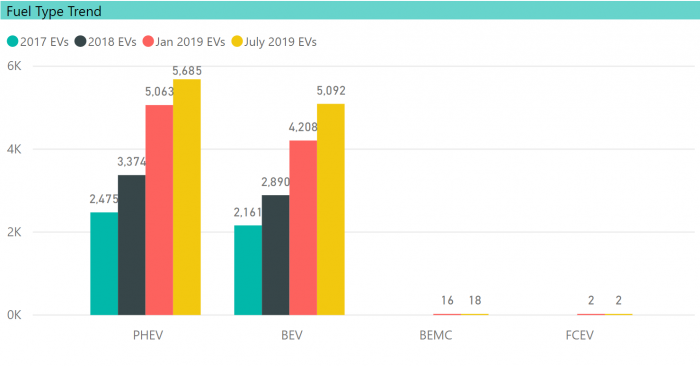
53% of EVs are of the Plug-in Hybrid (PHEV) variety. Battery Electric Vehicles (BEV) are growing at a faster rate, mainly due to Tesla. However, the great majority of EV offerings from most other manufacturers are PHEVs, which is driving this. We expect the balance will change in a few years. BEMC refers to Battery Electric Motorcycles, and FCEV refers to Fuel Cell EVs.
Make
The story this year, much like last year, was that most of the growth was driven by Tesla. This is despite whatever sales friction exists due to CT still being among the handful of states that do not allow Tesla to open their own stores, and, of course, Tesla being in the phase-out of the Federal Tax Credit. Hyundai had a modest pop. All of the other manufacturers were either treading water or had lost ground. Honda, which had a boost last year with the PHEV Clarity, has flattened. There is a report in Inside EVs that Honda has pulled back on distribution and is now selling it only in California. The two makes that lost the most ground were Chevrolet and Ford. The chart excerpt below shows the trend of registered EVs by make for the four data points we have going back to 2017. The chart is an excerpt and includes those with the highest numbers as of July 2019.
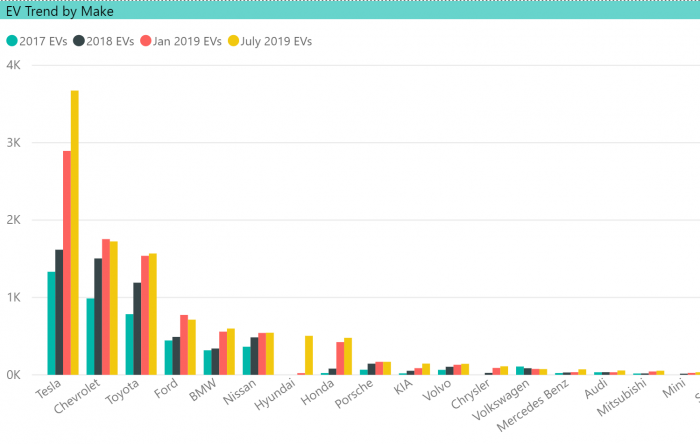
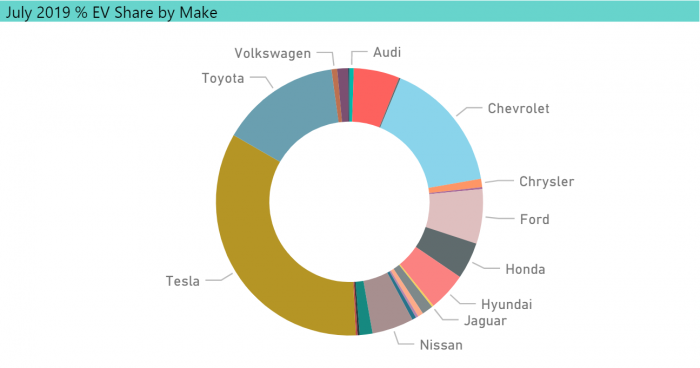
Tesla now accounts for 34% of EVs registered in the state. As recently as 2018, the numbers for Tesla, Chevrolet, and Toyota were close, but that is no longer the case.
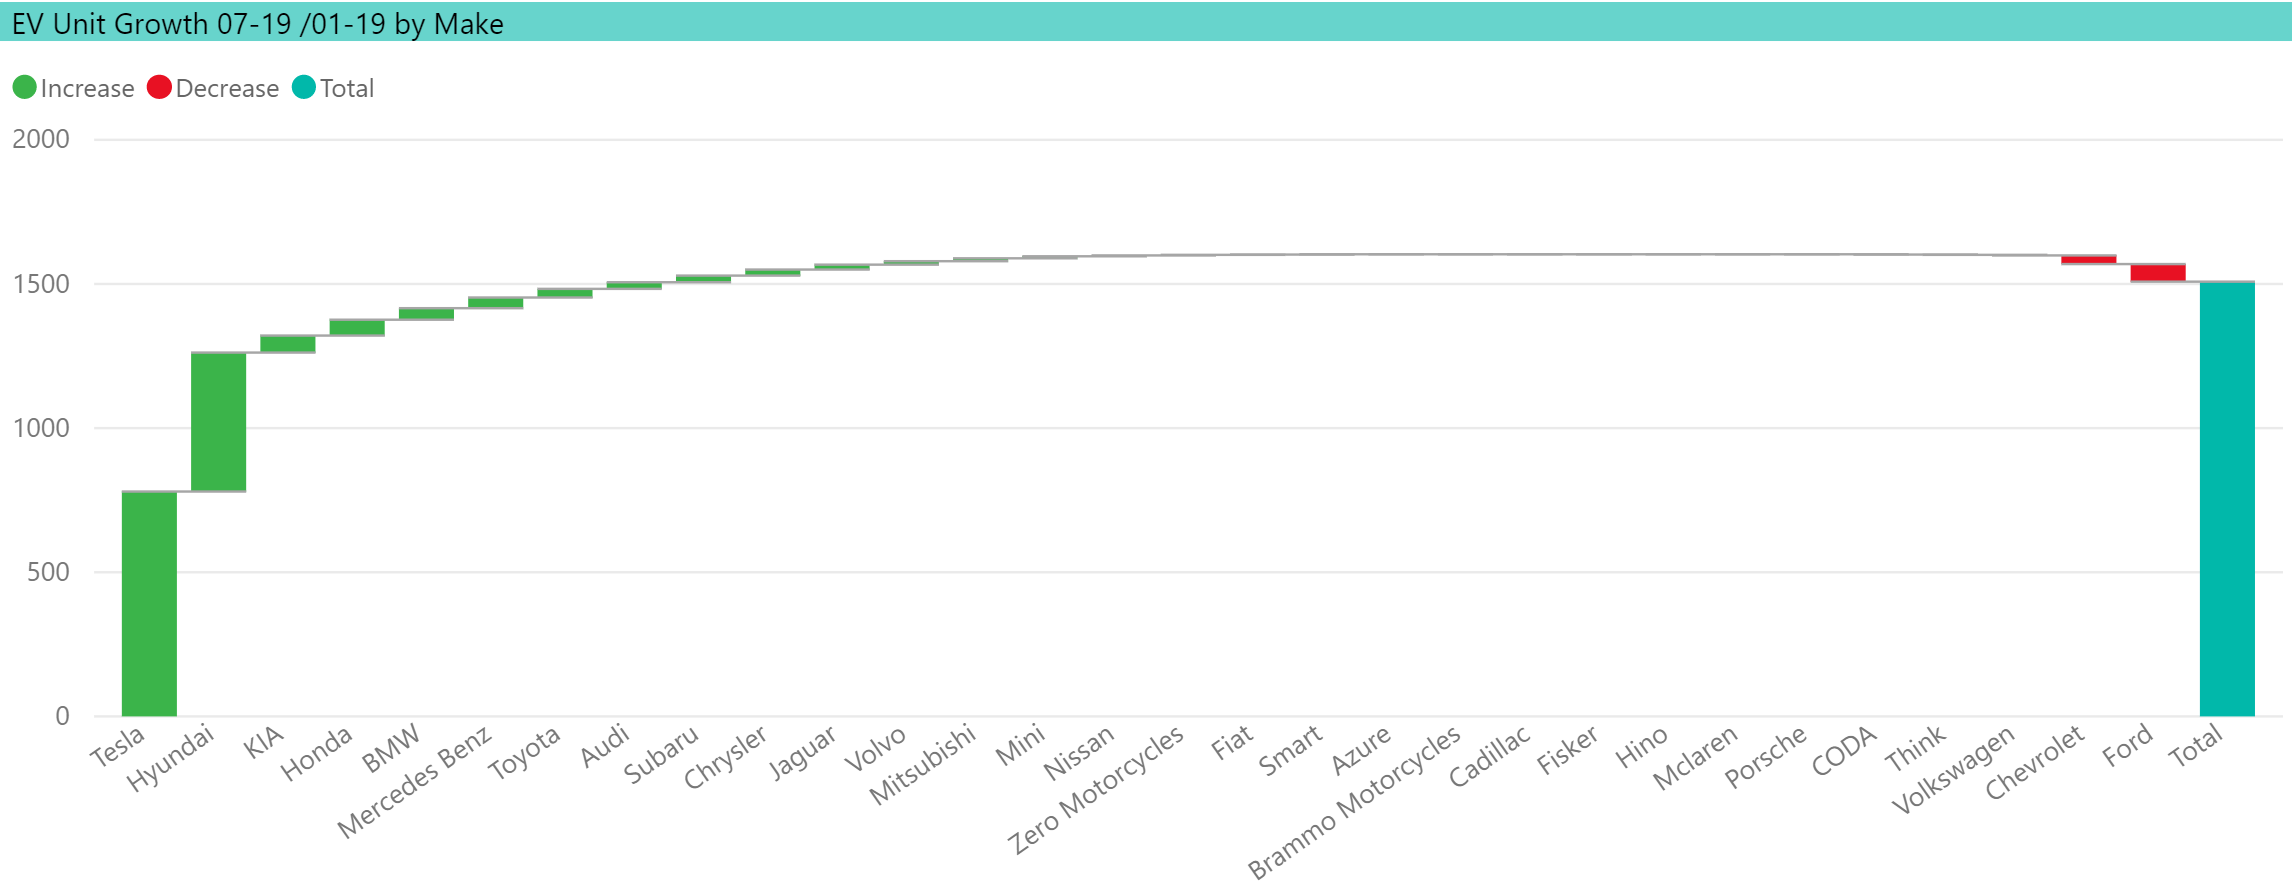
This waterfall chart looks at the contribution to incremental growth between January and July by make. Tesla was responsible for 52% of net EV growth. This was an increase of 780 units out of the net growth of 1508. Hyundai accounted for 32%. All other makes ranged from slightly below 4% to -4%.
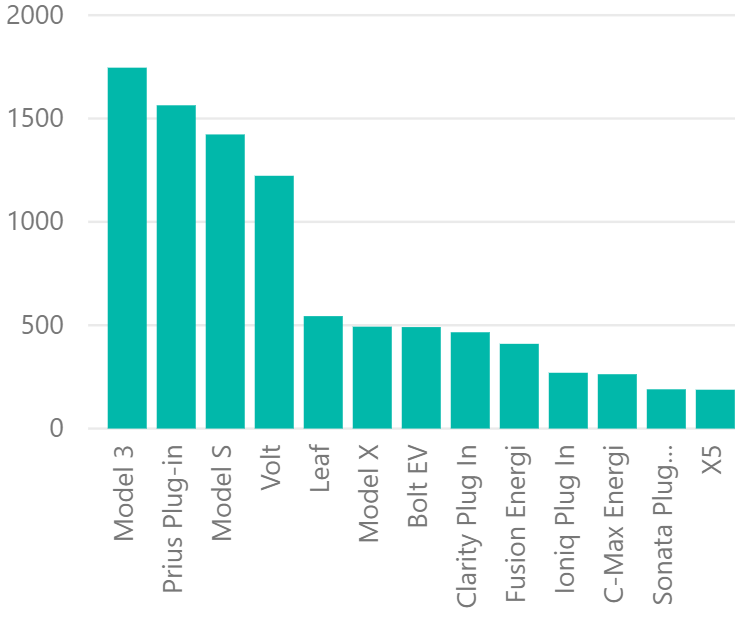
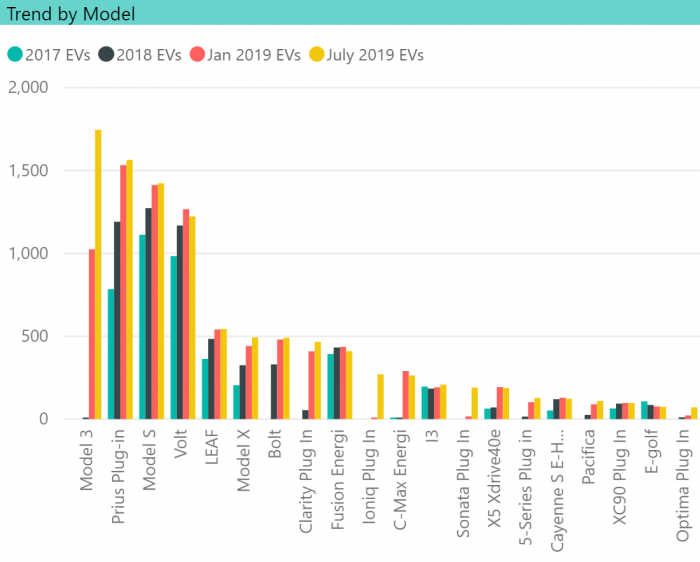
Model
The Tesla Model 3 is now the most widely registered Model, less than 2 years after it became available. And, as one can see from the jump in the size of the bar, it is THE story in the EV world for the past 12 months. It is a great early success story, has overwhelmed every other model, and has arguably been something of a double-edged sword for Tesla as the growth of the Models S and X has slowed (more so the S).
The Prius Plug-in is second. (Note: The Prius numbers combine the gen 1 Plug-in Prius with the newer, and better selling, Prius Prime.) In the third position is the Model S, followed by the Chevy Volt. With the discontinuance of the Volt in March 2019, the sales of this model are drastically reduced as GM clears out remaining inventory. On this chart, the number of Volts shows a decline since January, meaning that turnover is greater than newly acquired vehicles being registered. This chart is also an excerpt of the most widely registered models as there are too many to display here.
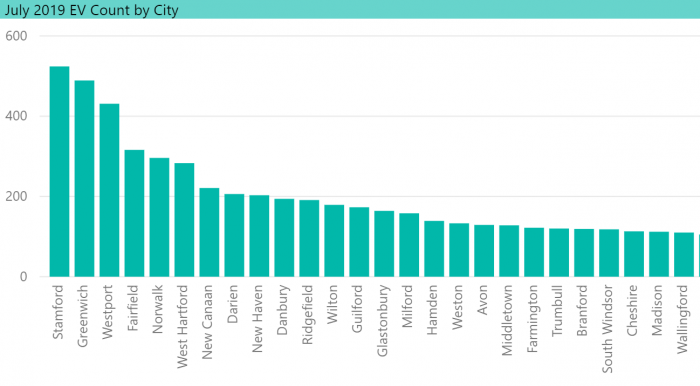
EVs by City/County
The cities with the highest number of EVs are Stamford (524), Greenwich (489), Westport (431), Fairfield (316), and Norwalk (296). The chart below is an excerpt of the cities with the most EVs.
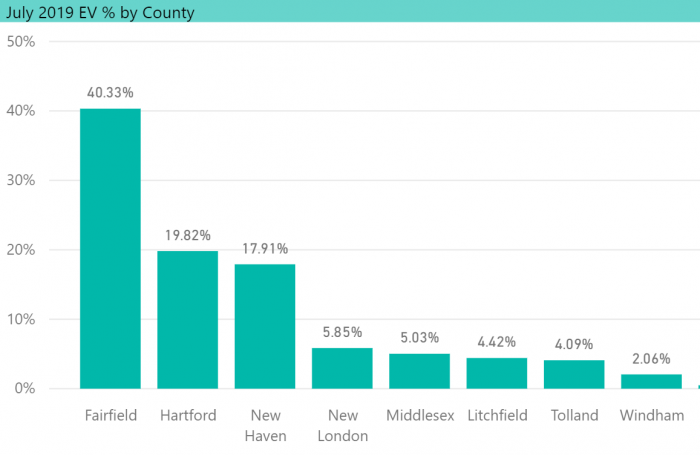
Fairfield County, in general, is where the largest concentration of EVs can be found, accounting for 40% of EVs in the state.
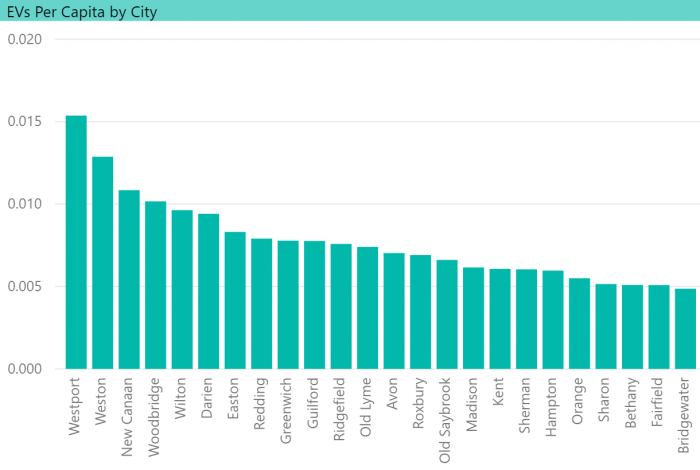
Per-Capita
On a per-capita basis, Westport is the leading city, followed by Weston, New Canaan, Woodbridge, and Wilton. The chart below is also an excerpt due to space limitations.
In the chart below, the size of the bubble reflects the count of EVs and the coloration is based on per-capita. The darkest blue-green has the highest per-capita and the deepest red is the lowest.
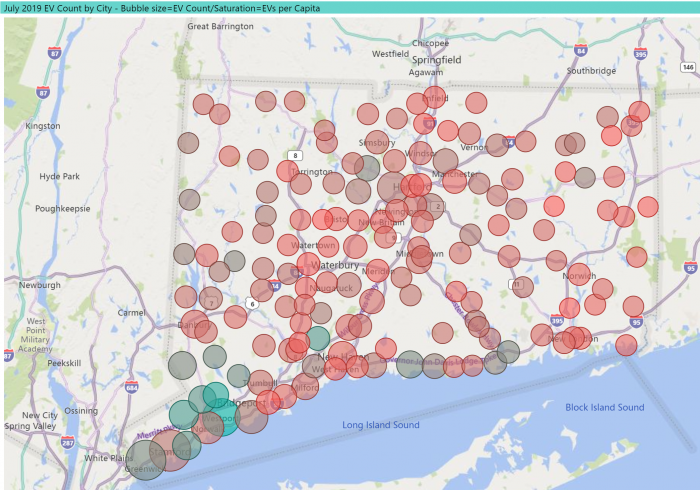
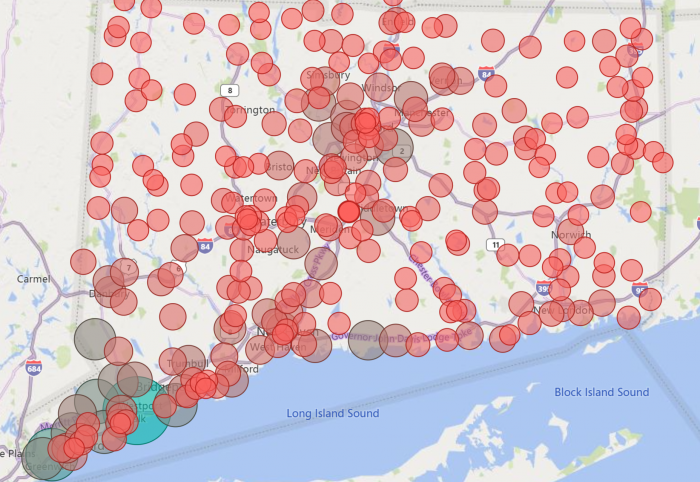
EVs by Zip Code
The final map displays EVs by zip code. Yes, the chart is dense where the populatioin is dense, and it reinforces what we already know from the cities, but gives added granularity. Notice how adjacent zip codes in Fairfield County span the highest to lowest levels of EV representation.
Thank you! But why are you reading about EV content in Connecticut, USA?