July 1 EV Registration Data
Post by Barry Kresch
Overall Trends
Following an earlier blog post updating topline registration data, I have now been through the details and will cover them over the course of several more posts.
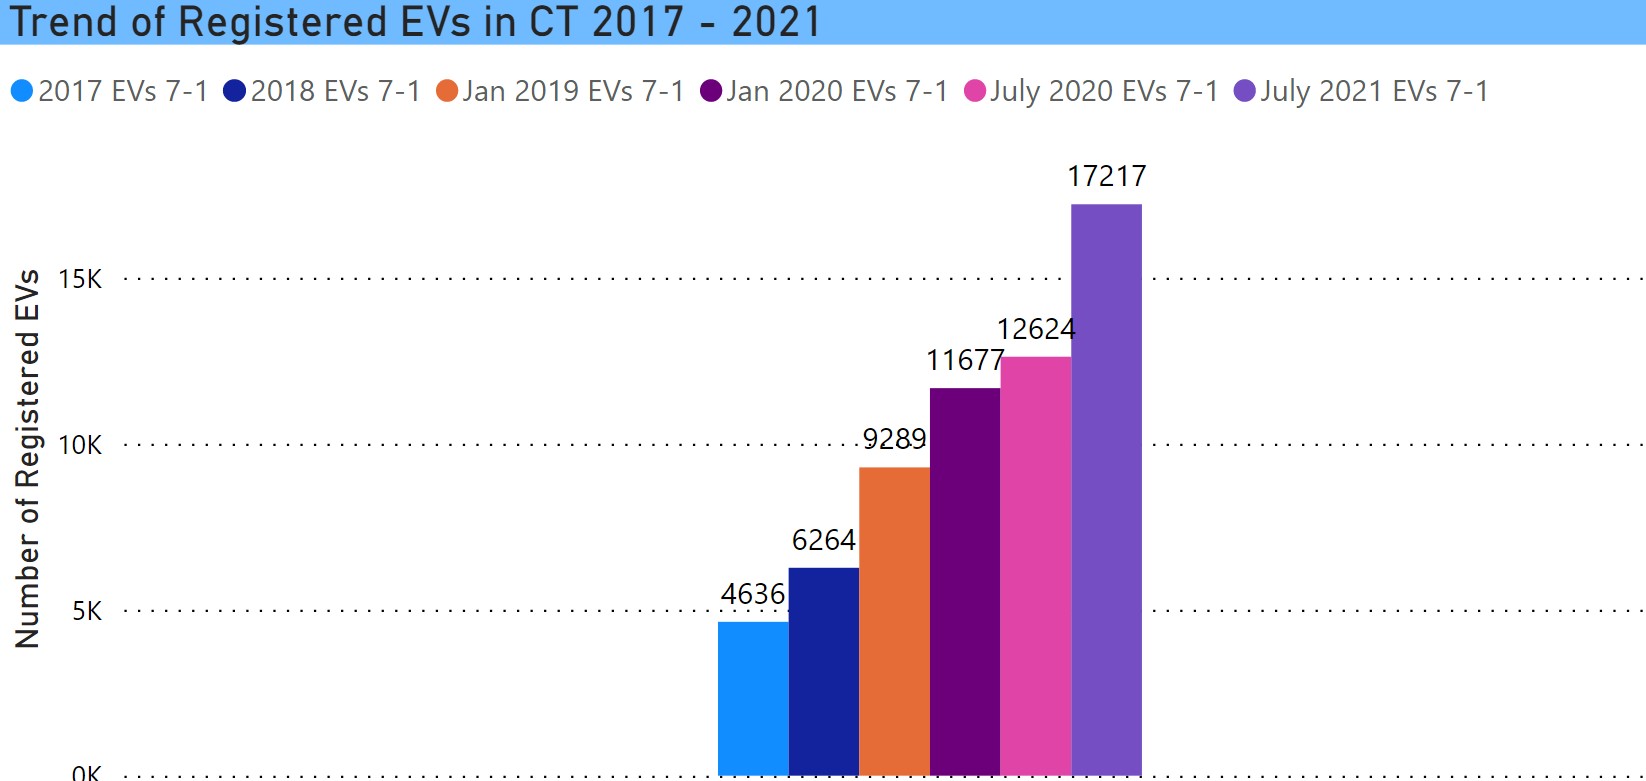
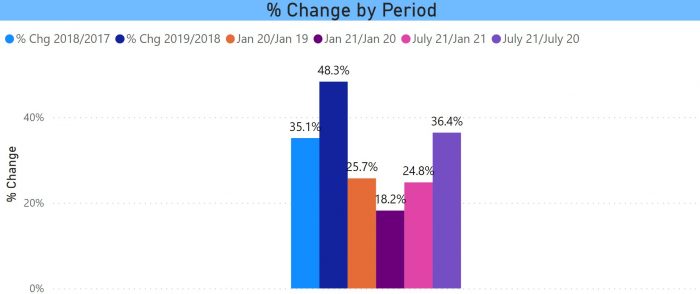
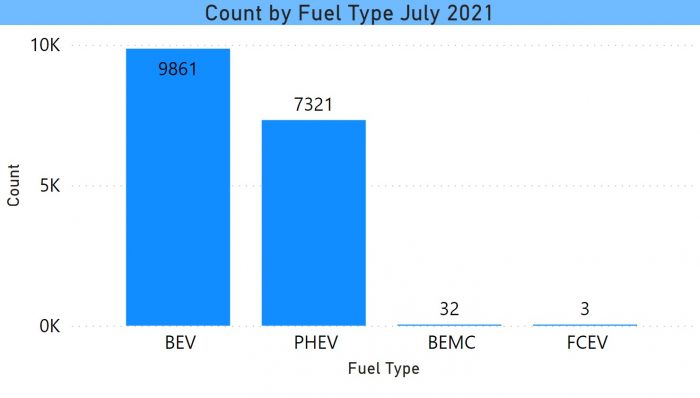
As earlier reported, total electric vehicle registrations now total 17,217. This represents an increase of 36% over July 2020.
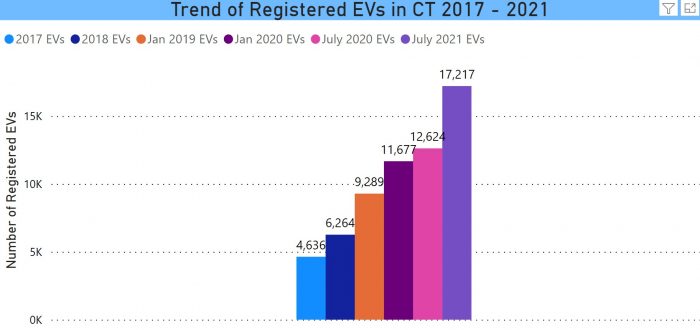
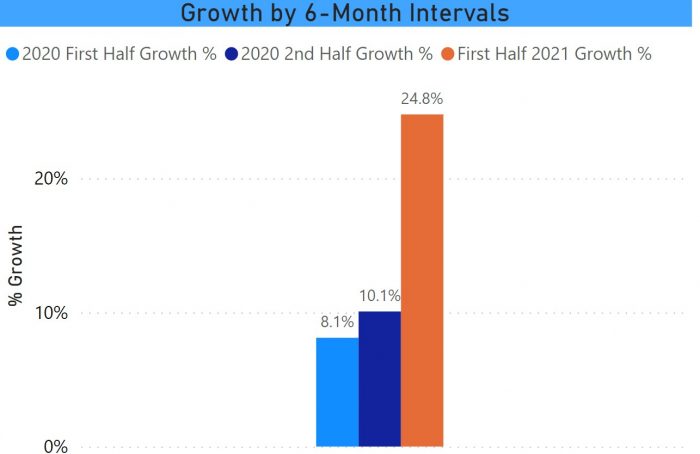
Definitely an improvement, but we need more on a sustained basis. The glimmer of good news is that, not surprisingly, the bulk of the growth was recent. The last 6 months are growing at close to the pace we need. The chart below looks at semi-annual growth for the past 18 months.
Fuel Type
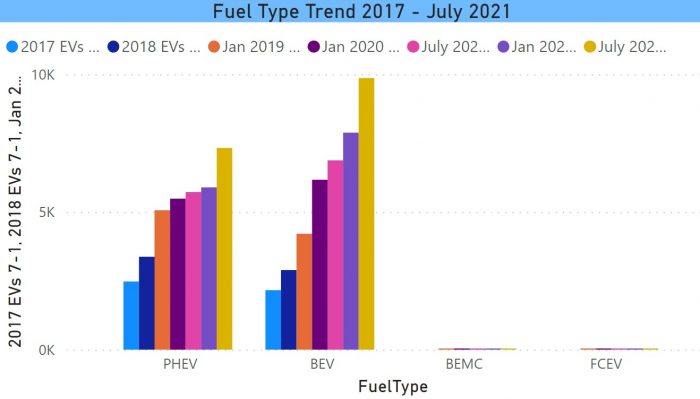
Below is the trend by fuel type from 2017 through July 2021. For those new to the lingo, BEV = battery electric vehicle, PHEV = Plug-in Hybrid EV, BEMC = battery electric motorcycles, FCEV = Fuel Cell EV. BEVs have continued to outpace the other major category, PHEV.
BEVs outpaced the field. I will get into more detail in a subsequent post, but the big difference-maker was the Model Y. PHEVs, having been flat pretty much since the demise of the Chevy Volt, rebounded this year on the strength of two Toyota models: Prius Prime and the new RAV4 Prime.
When I have discussed the information on this project with reporters over the years, the first thing they ask is how many fuel cell vehicles there are. There are 3, as there have been. These vehicles are not currently available to buy in the state.
Vehicle Body Type
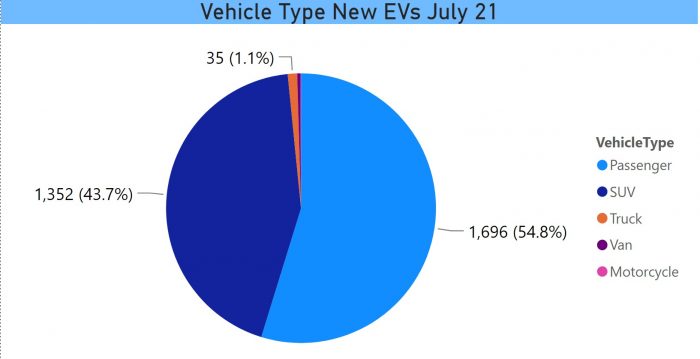
A new field in the dataset this year is vehicle body type. An imponderable: Will I continue to receive it? The two pie charts below show the vehicles that were new to the file in first-half ’21 and all EVs as of July 1. So the vehicles in the first chart are included in the second and comprise about 25% of the total. With the Model Y and some other new models, the SUV percentage of the fleet is growing rapidly. 36% of the adds were SUVs, bringing the total file to 20%.

This probably understates how popular these vehicles are becoming. Keep in mind that this file is registrations and not sales. If I restrict the new vehicle chart to the most recent vehicles, MY 2021 and 2022, the SUV percentage goes to 44%.
All data in this post come from the Interactive EV Dashboard, July 2021

