Where the EVs Are 2024

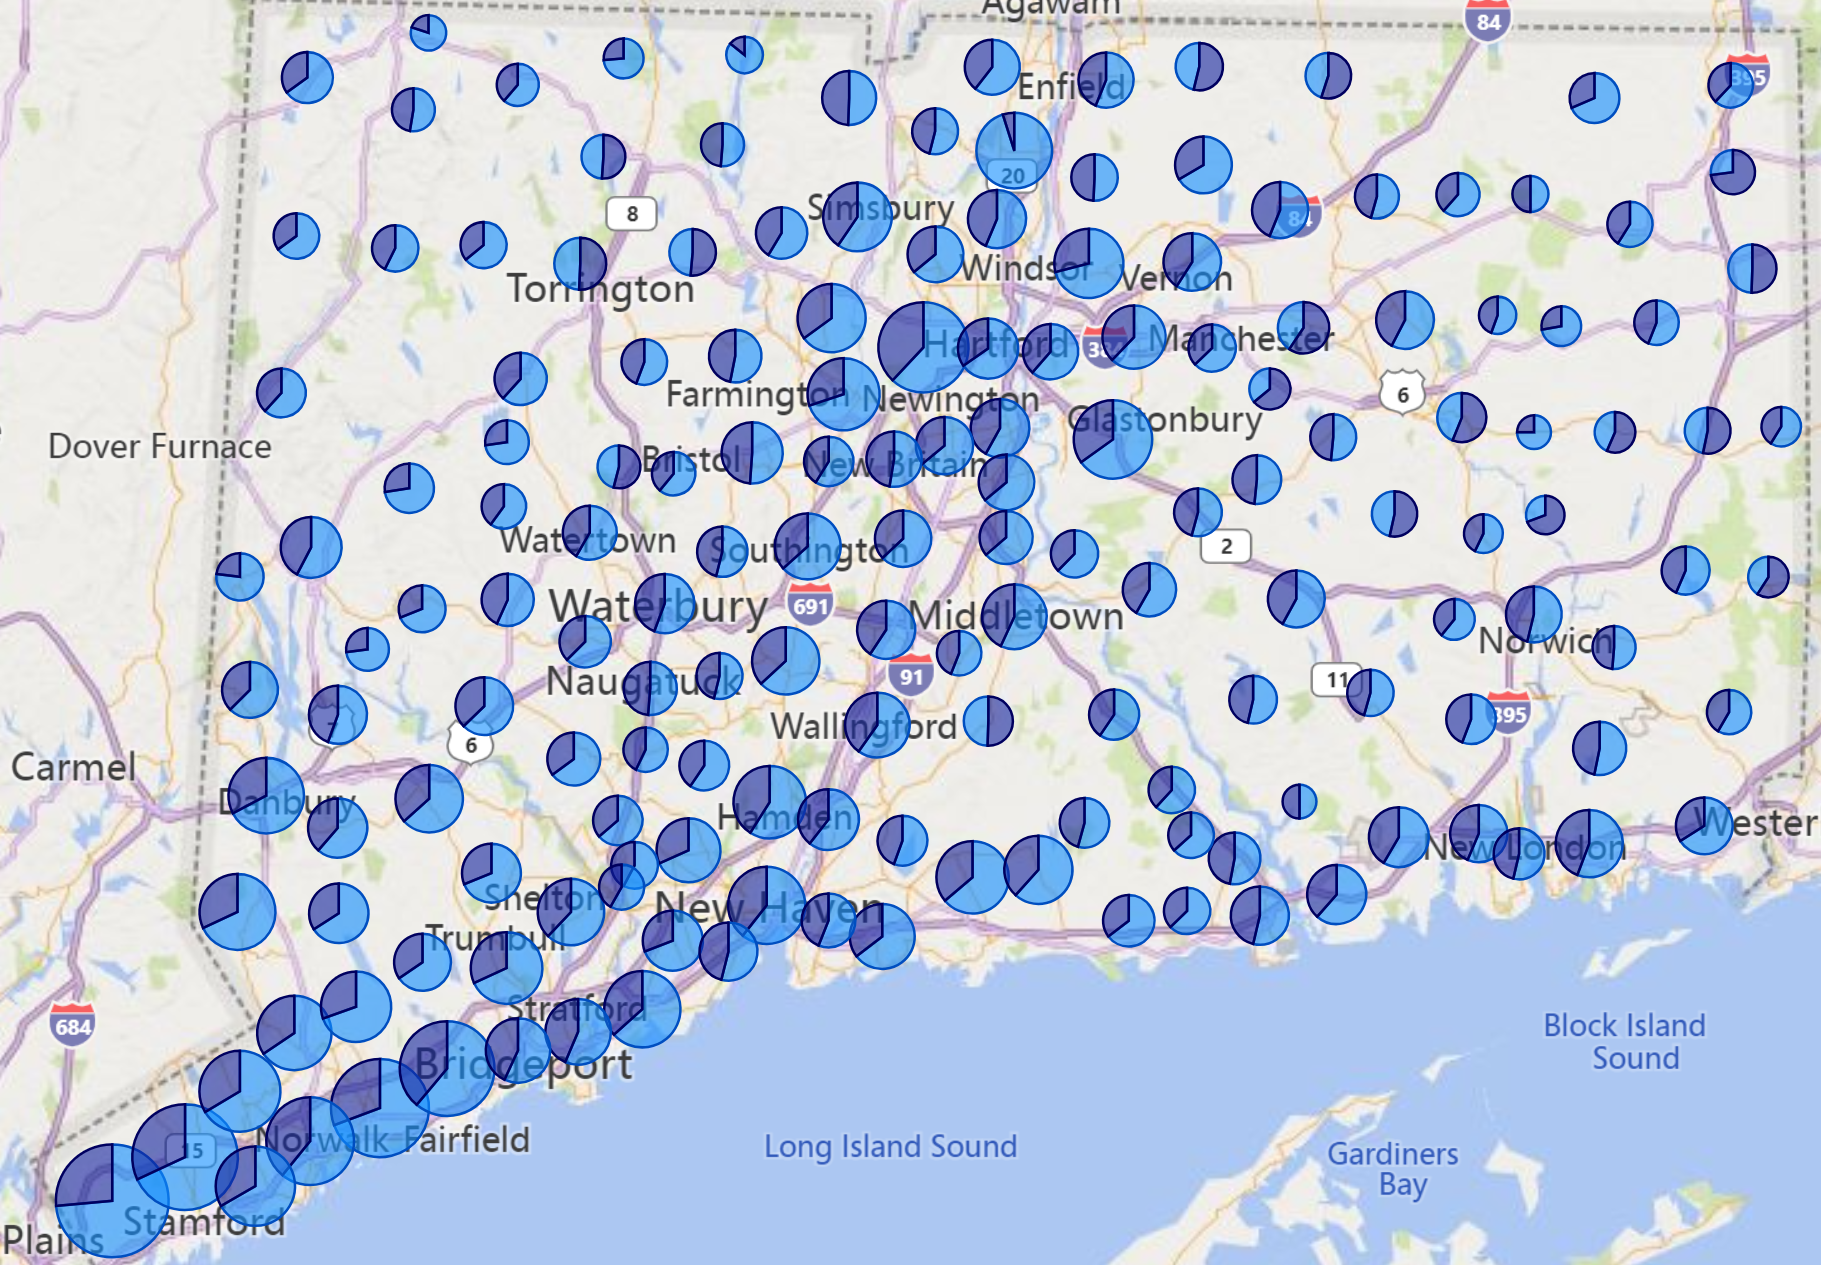
The map at the top of the page depicts the EV count by city. The bubble size reflects the overall count and the pie wedges show BEV (light blue) and PHEV (dark blue).

Not all of the charts below have numbers due to the space constraints of a static screenshot. We will be publishing an updated dashboard (tbd) with full interactivity and slicers. If anyone needs a number, please reach out to the club at info@evclubct.com.

The source for the data is the DMV, but it was accessed via the Atlas EV Hub.

EVs by County

Fairfield County continues to be EV central for CT. The other counties retain the same rank as one year ago.

EVs by County Jan 2024

EV Counts by City

Below are the EV counts by city, followed by the trend for each city starting with January 2022 (5 waves of data). You will note a fairly large bar labeled “blank.” This is due to a combination of vehicles in the file having blank geo records and some others listed with zip codes that aren’t in CT. The file comes to us by zip code (now anyway, it wasn’t always the case) and so when it gets married to the city, it reverts to a “blank” label. It is, apparently, possible for the DMV to maintain a record of a vehicle garaged in the state with an out of state zip. The relatively high number for Windsor Locks, we think, represents airport rentals. The fact that it is trending slightly downward may reflect Hertz shedding EVs.

Greenwich leads with 2542 EVs. Stamford, Westport, Fairfield, and West Hartford round out the top 5 cities.

EV Count By City in CT Jan 24

EV Trend by City 0124

Other stats – EVs per capita and EVs as a percentage of all vehicles. We are getting to the point where EVs now make up a measurable percentage of vehicles in some municipalities.

Jan 24 EVs per Capita by City in CT

EVs as % all vehicles by City 0124

Finally, there is make within city. It required multiple screenshots to capture all the vehicle makes in the legend if you want to decipher the colors in the bars.

Make within City legend 2

make within city legend 3

EV Count - Make Within CT City Jan 24


Where The EVs Are – July 2021

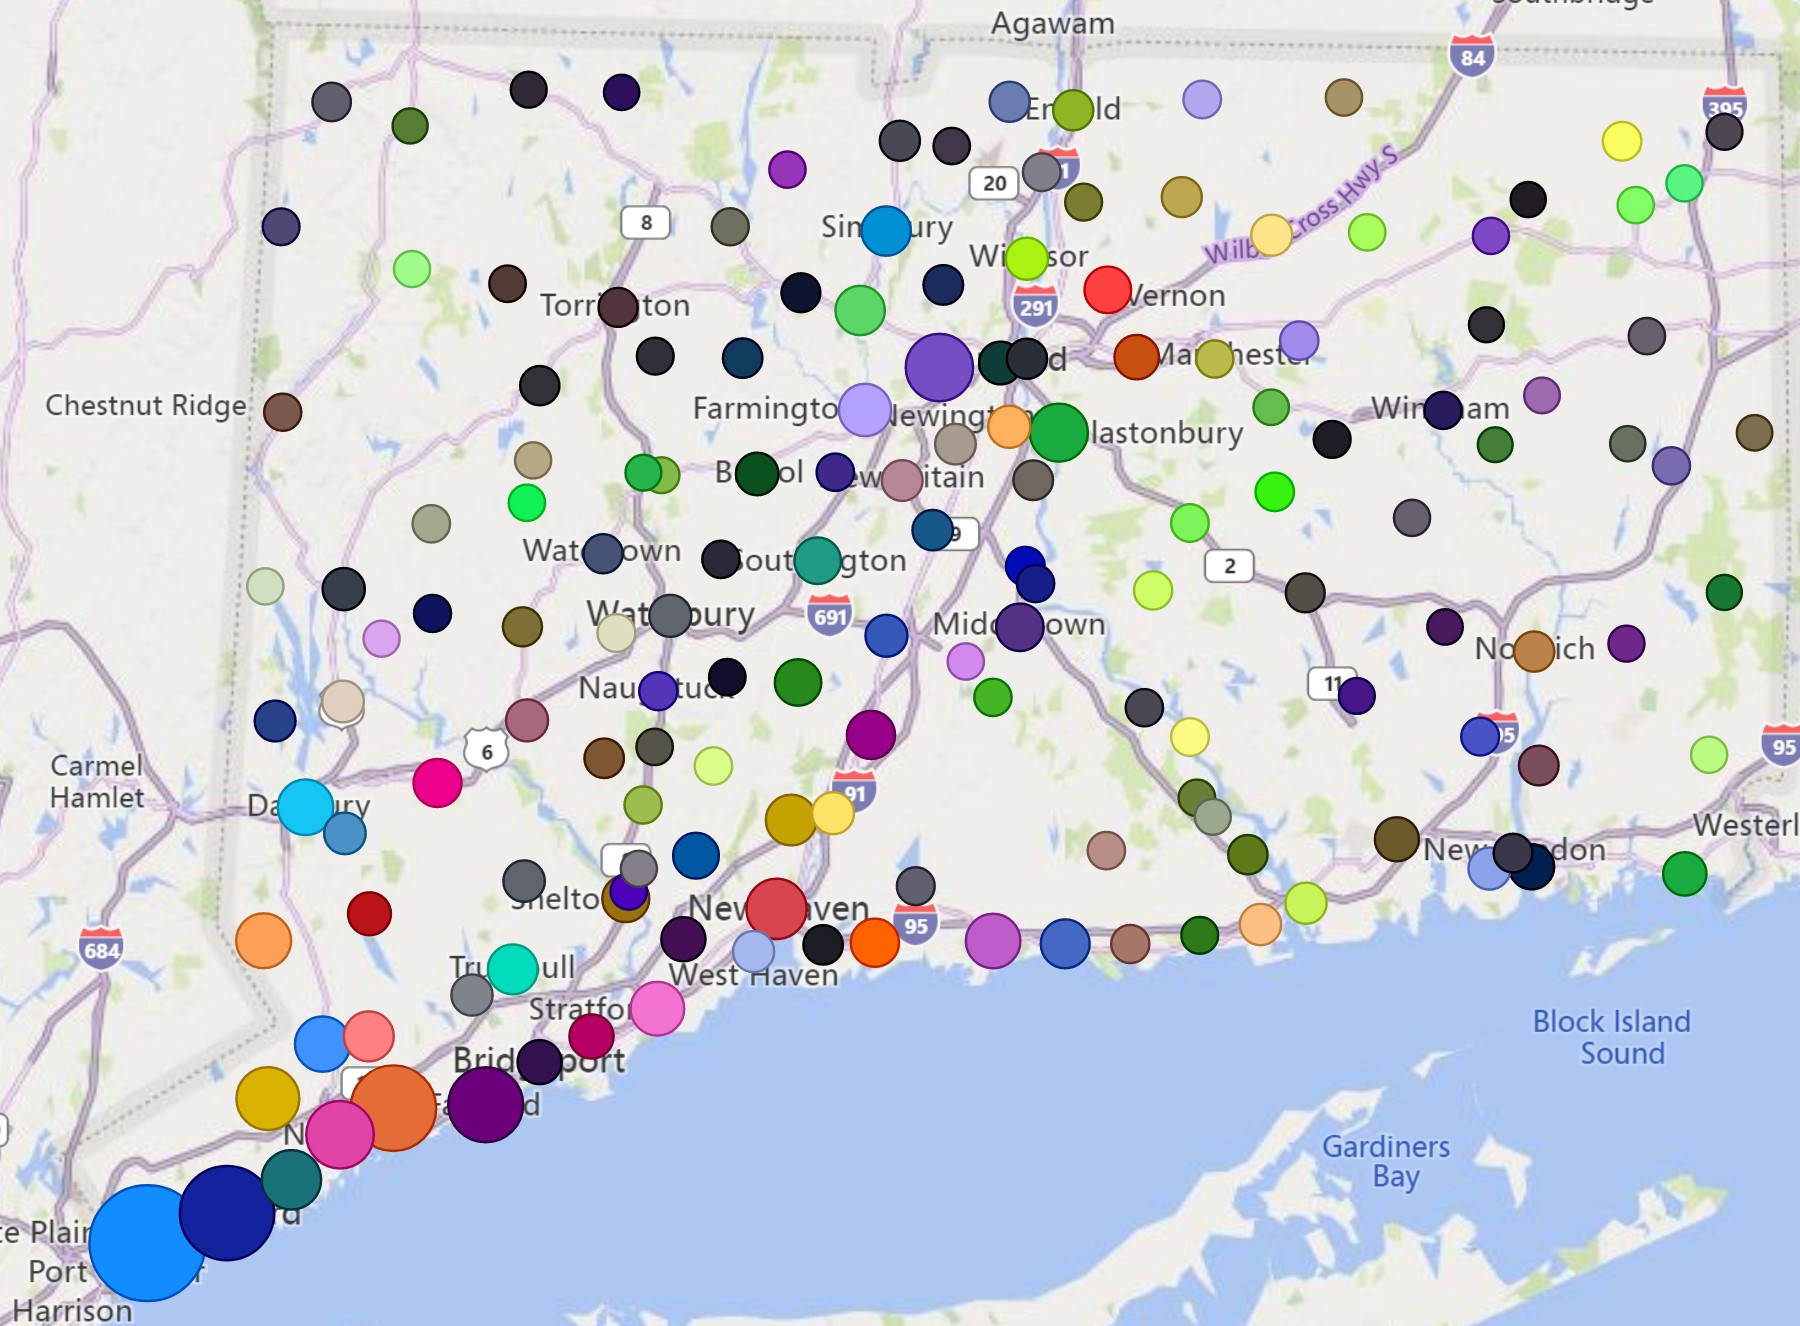
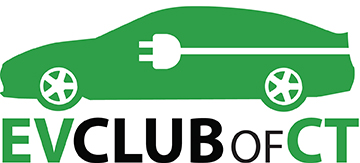
Fairfield County is Home to 41% of EVs

7023 of 17,217 EVs in the state are registered in Fairfield County.

EVs by County in CT

The map at the top of the post shows the distribution of EVs across cities. The larger the bubble the greater the number of EVs, with the top cities being Greenwich, Stamford, Westport, Fairfield, Norwalk, West Hartford, and New Canaan. These ranks don’t change that quickly but Norwalk has overtaken West Hartford. There is nowhere near enough room to display all cities in the static screenshot of the recent trend below. In the interactive dashboard, there is both a slider and a slicer to help navigate the larger charts.

EV trend by city

Adjusting for population reveals a different rank with mostly smaller towns in Fairfield County dominating: Westport, Weston, New Canaan, Greenwich, Woodbridge, Darien, and Wilton.

EVs Per Capita by City

The two charts below show EVs by make by city. These do not come directly from the DMV because the DMV separates the geo from the other information. I have created my own estimates based on the available data. Again, the screenshot is not large enough to display all cities and all of the makes in the legend. The dominant orange color is Tesla. Below the bar chart is the same data in map form with bubbles sized to overall EVs and the wedges representing each make. Again, it looks better in the dashboard which has more visual flexibility.

EVs by Make by City

Map of EVs by City by Make July '21

If anyone has any questions about a particular city, please email EVClubCT@gmail.com.


Jan 2020 EV Dashboard Update – Geography Edition

EV ownership remains concentrated in Fairfield County.

The county is home to 41% of all EVs registered in the state.

% EVs by County
Chart: Barry Kresch

EV Ownership by City

It follows then that the cities with the highest EV ownership are mostly in southwestern CT. Greenwich, Stamford, and Westport are the top three. The following chart is an excerpt displaying the highest-ranking cities.

EV Count by City in CT
Chart: Barry Kresch

EV Ownership by City, Per Capita

When the data are normalized for population, the ranking changes with Westport being number one, followed by Weston and Woodbridge.

EV Ownership in CT by City, Ranked Per Capita
Chart: Barry Kresch

Map of EV Ownership by City

This is what it looks like pictorially. The bubbles represent cities and the size of the bubble adjusts based on the number of EVs registered in each city.

Map of EVs by City in CT, Jan 2020
Chart: Barry Kresch