
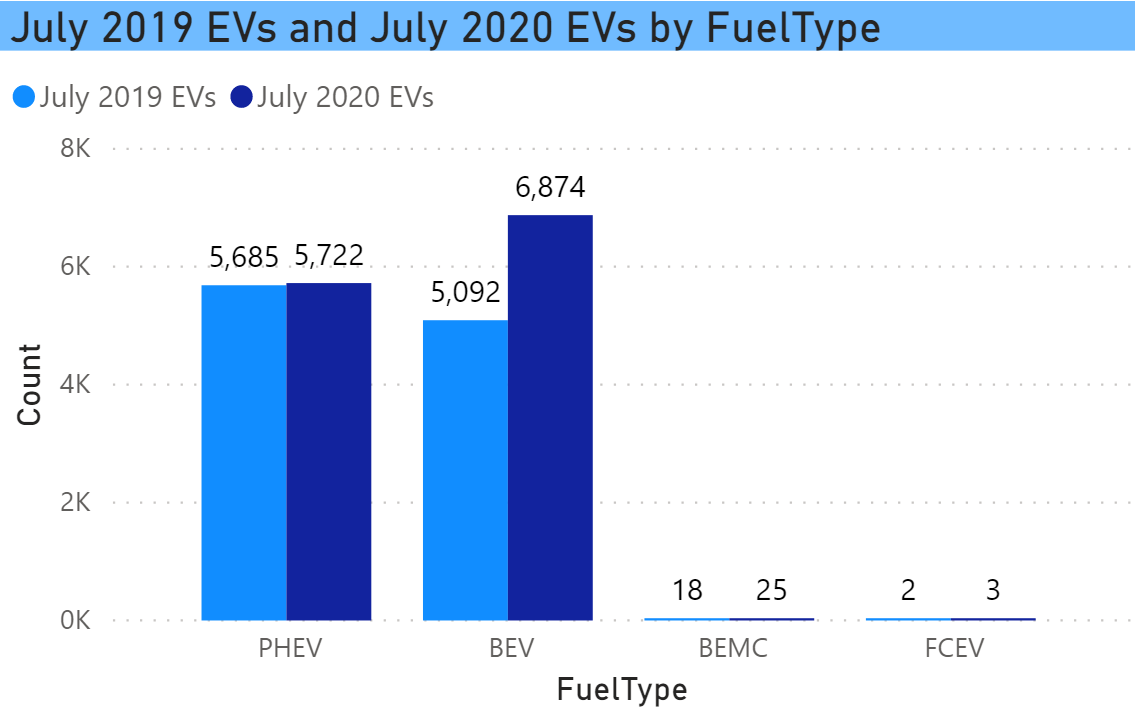
Fuel Type Trend
The mid-year 2020 update for the interactive EV Dashboard has been published. The relatively strong performance for BEVs contrasts with the change for PHEVs, which increased only 1% over the past 12 months. As of July 1, there were 6874 BEVs and 5092 PHEVs (along with 25 electric motorcycles and 3 fuel cell vehicles).
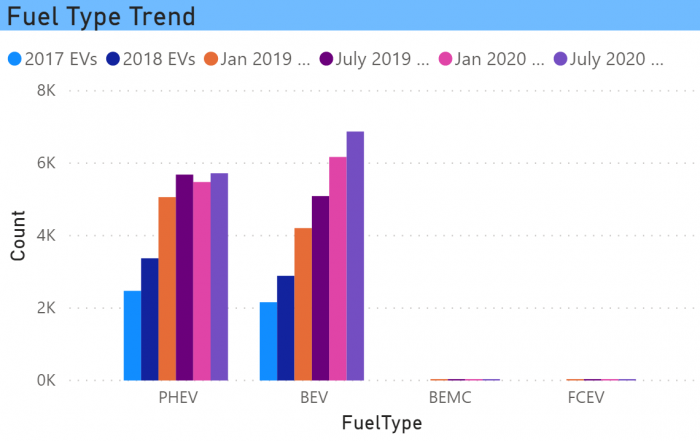
This has been the recent trend, with PHEV growth leveling off beginning with the January 2019 data point (covering the 2018 calendar year).
Trend of Registered EVs
There are now 12,624 EVs registered in the state, as of July 1.
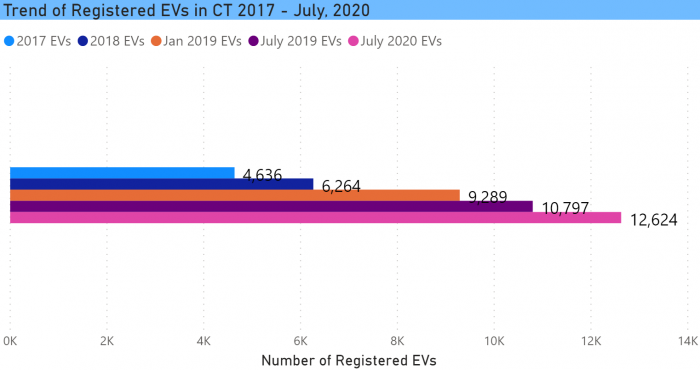
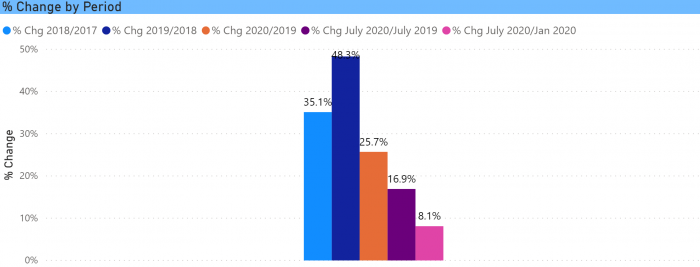
While the overall EV growth was slower than we would like, the last 6 months, perhaps surprisingly since they included the pandemic, was similar to the prior 6 months. There have been reports of EVs suffering a smaller sales decline than the industry at large. The 16.9% growth rate of the past 12 months is almost exactly double the 8.1% of the last 6 months.
Trends by Make
The pattern that we have seen over the last few iterations of the dashboard holds here, namely that Tesla is the big driver. This chart tracks the change in EV registrations by Make since 2017. It is an excerpt – all makes are available in the dashboard.
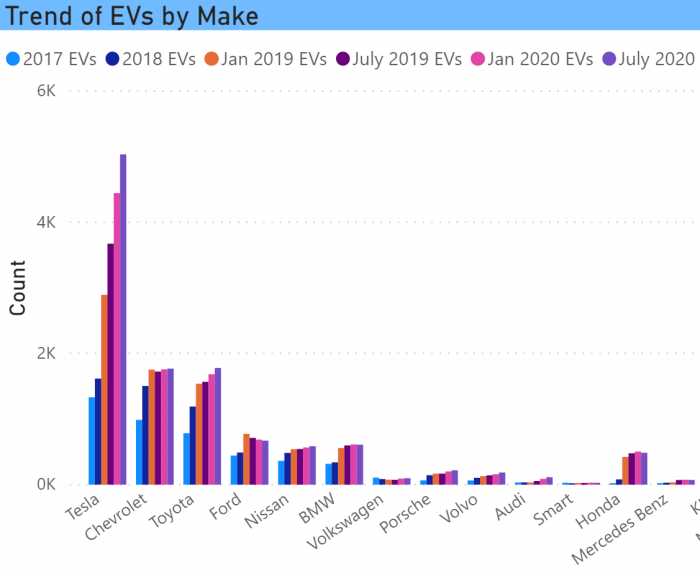
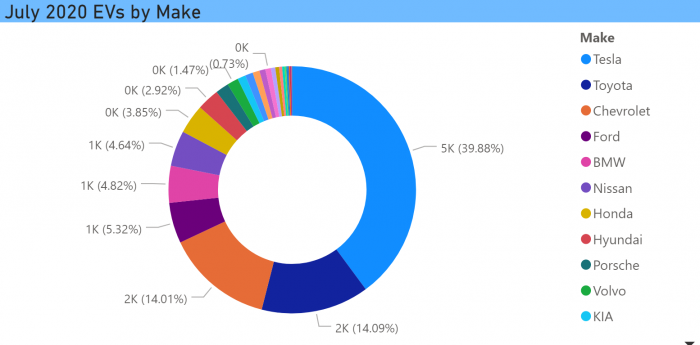
Tesla now accounts for 40% of all registered EVs in the state with 5035 vehicles. (For charts in this blog post that do not display values, those can also be seen on the dashboard by hovering over a chart element.)
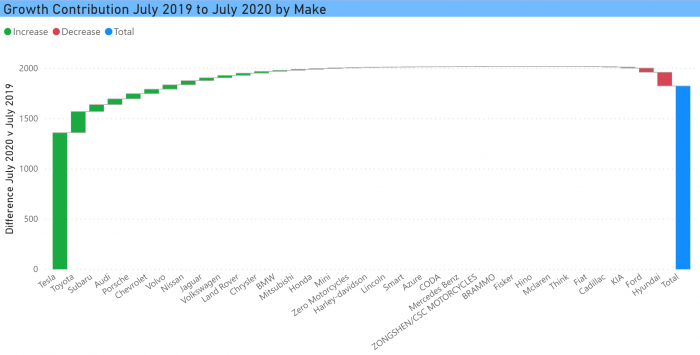
If we look at it from the perspective of the contribution of each make to the increase of the past 12 months, it is even clearer. This waterfall chart shows that Tesla was responsible for 74% of EV growth (all EVs, not just BEVs). Some manufacturers, as can also be seen in the trend chart, are seeing declines in net cumulative registrations.
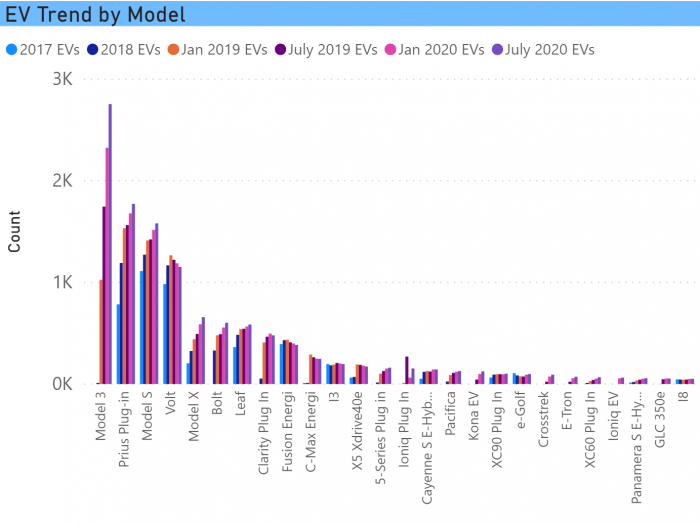
Trends by Model
When we drill into the individual models, it is the Model 3 that defines the picture. The growth of the Toyota Prius Prime (Prius Plug-in and Prius Prime are combined in these charts) has greatly slowed. The Model S and X have a steady, but not terribly large increase (and it is likely the Model 3 is cutting into sales of the S in particular). The Model Y has yet to make its presence felt with just 29 of them in the file. The Chevy Volt, once the most widely registered model in the state, has been discontinued. It has a presence in the used EV marketplace, but the overall numbers are showing a gradual decline. The Nissan Leaf is another major early EV that has slowed considerably in recent years.
The outlook for the rest of the year has to be characterized as uncertain. We aren’t close to being done with the pandemic and the bad economy. Manufacturers have delayed refreshes and new introductions until 2021. We are expecting significant refreshes for the and Bolt, the new Ford Mach-E, Rivian SUV and pickup, among others. The chart below is also an excerpt of individual model trends with the full chart available on the dashboard.
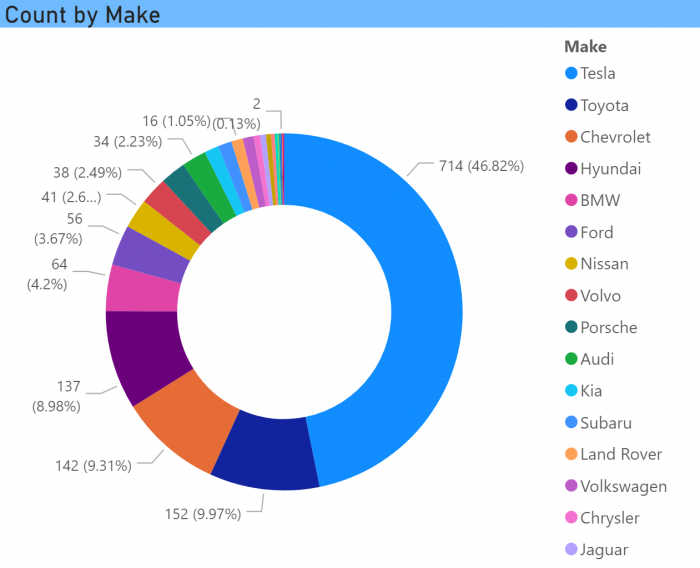
Newly Registered EVs
This is the chart of EVs by Make registered in the past 6 months. Tesla accounted for 47% of all new registrations, which is why it’s current share has increased, and why BEVs are growing. There were a total of 1525 vehicles registered in the past 6 months. With a turnover of 578 vehicles, the net increase was 947.
The increase we are seeing, assuming it remains similar for the second half of this year, is pacing below the necessary compound annual growth rate to meet the objectives of the ZEV MOU.
A word about the data:
The EV Club of CT has a standing Freedom of Information Act Request with the Department of Motor Vehicles. The DMV updates its census of EVs semi-annually, and when they do, they send us a file of the vehicle details. A reminder that this dataset is registrations, not sales. It includes new vehicle sales or leases, used EV purchases, people moving into the state who own EVs. We do not get the “denominator,” meaning all of the vehicles registered in the state, so we are not able to look at EV share of the total market.
The dashboard itself is interactive. Hovering over a chart element will display the value. The charts can be filtered by clicking in a chart element or by checking the boxes in the slicers. Multiple boxes can be checked. Please contact us if you have any questions.