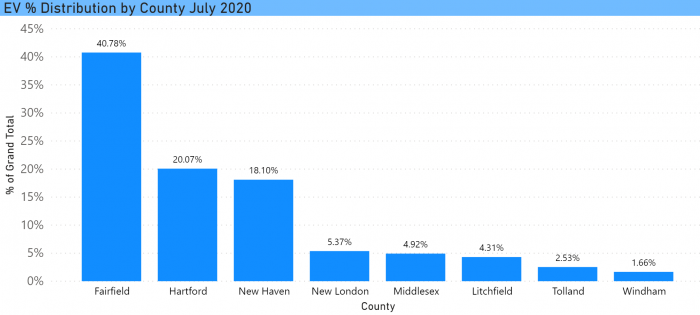
EVs are not uniformly distributed across the state
Fairfield County has consistently tracked at around 40% of EVs in the state and is 41% in this July 1, 2020 iteration. This compares with its having 26% of the state’s population. All of the other counties under-index relative to population.
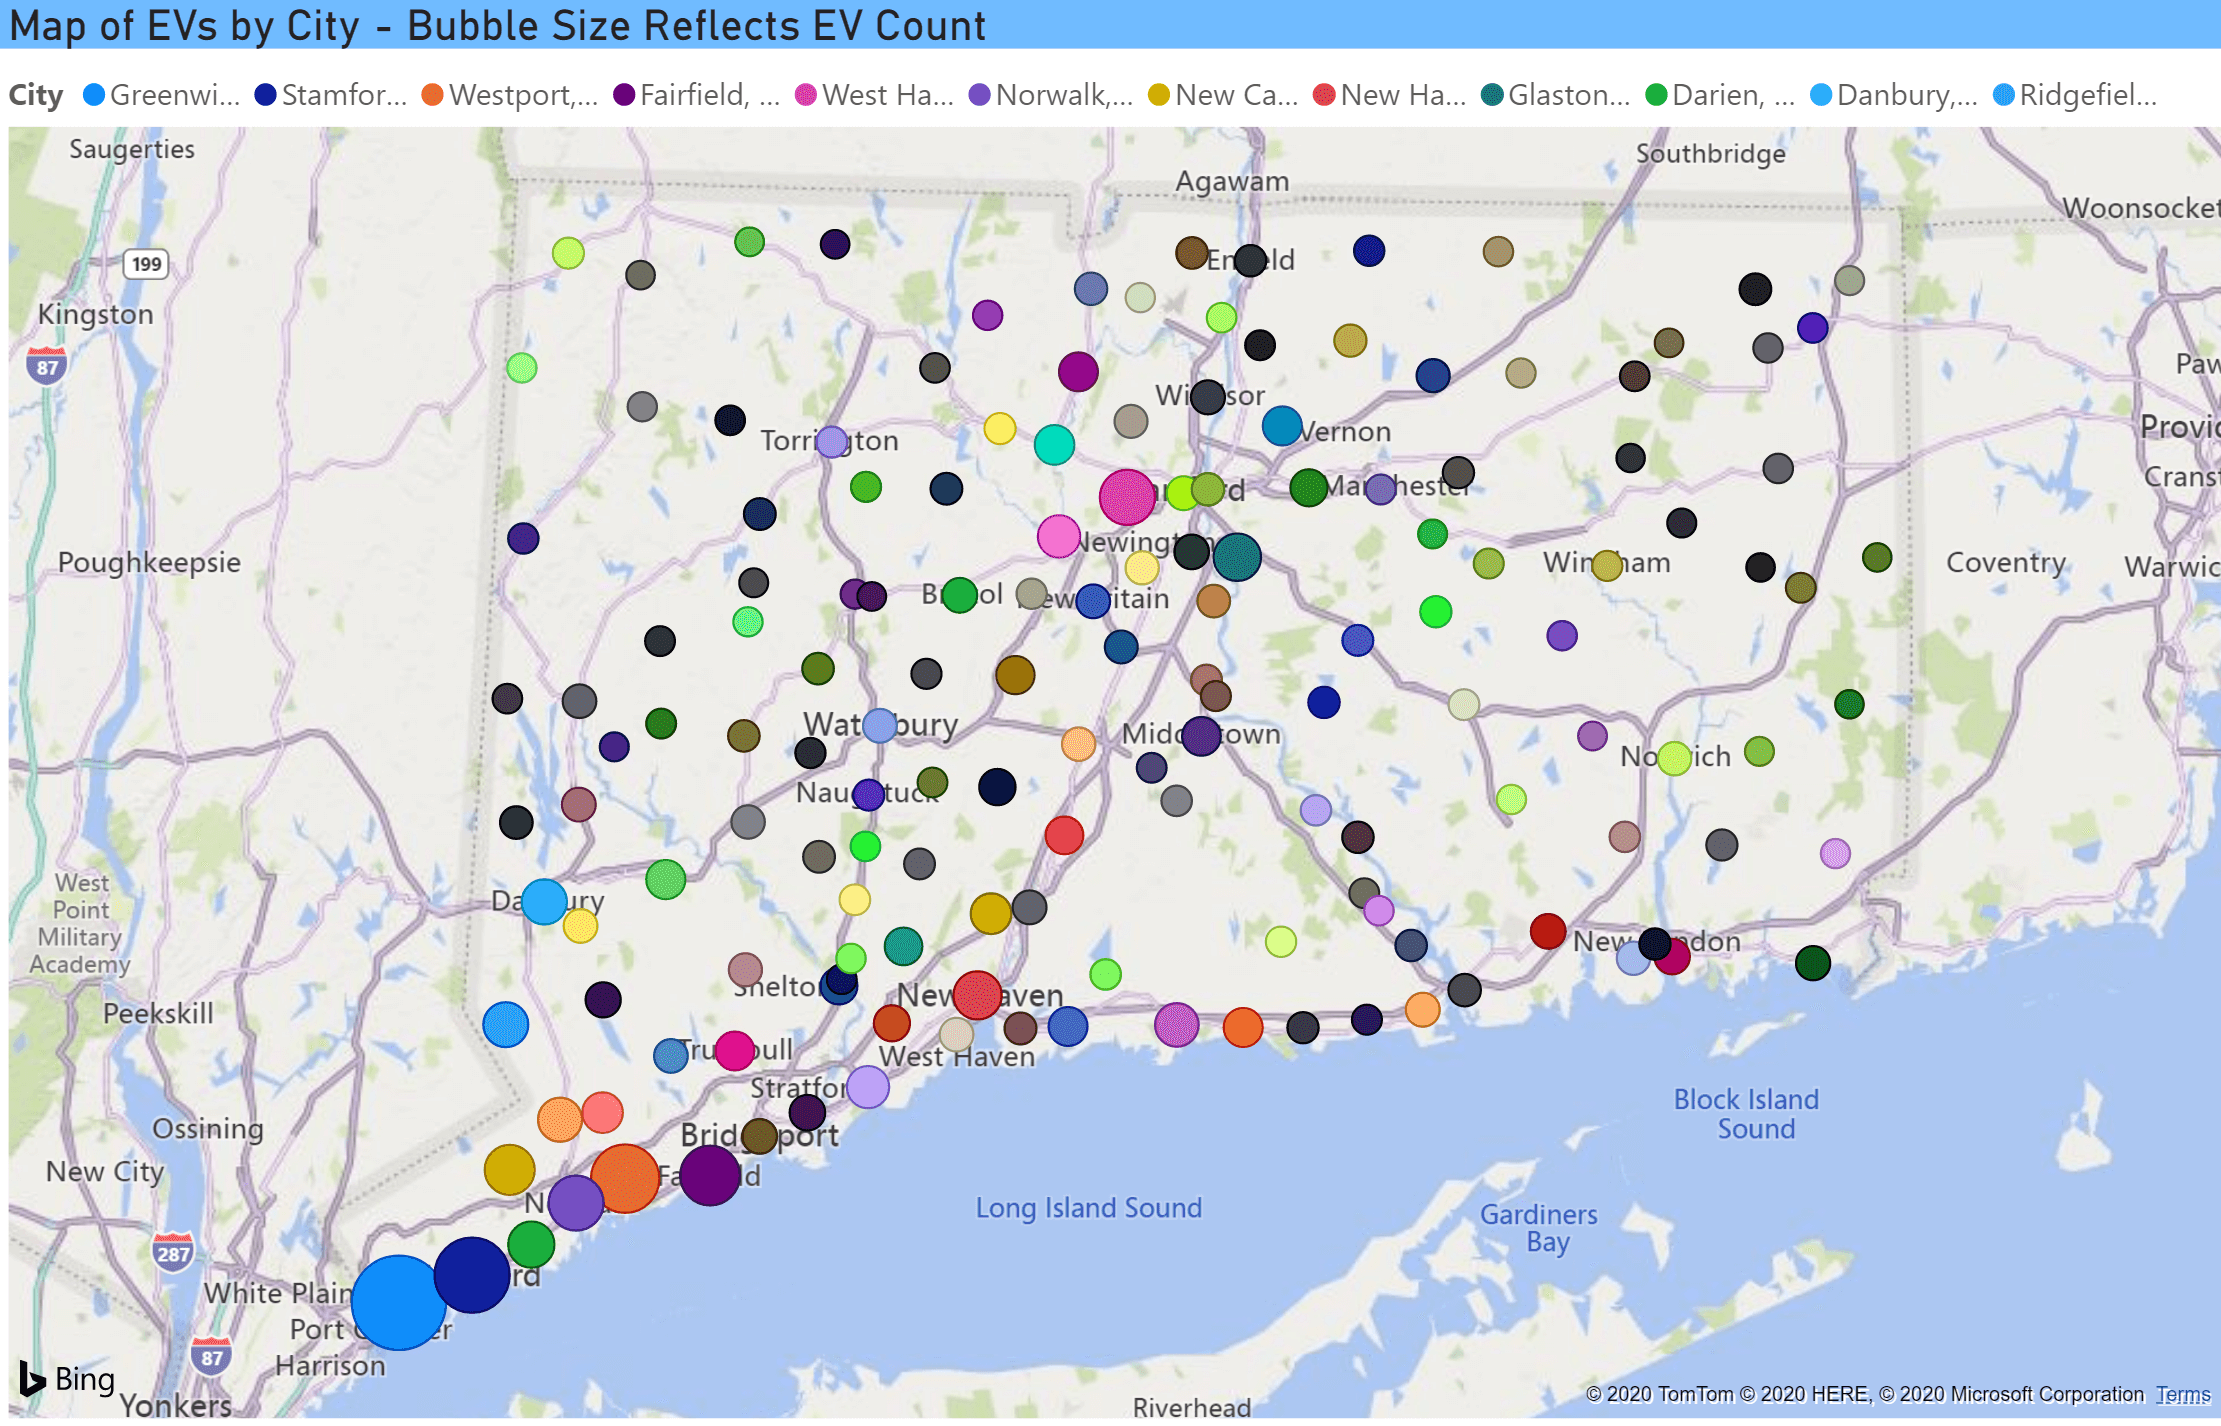
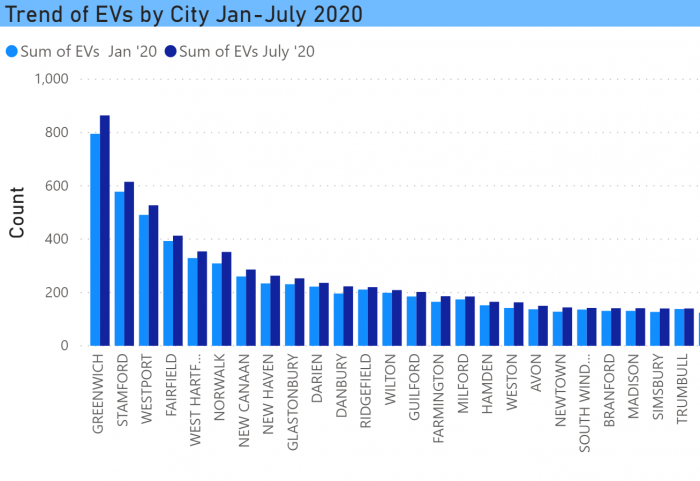
EV Distribution by City
The top cities largely held their position in terms of the number of registered EVs with Greenwich, Stamford, and Westport in the top 3 positions. This chart excerpt shows the most recent two data points, January and July, for the largest cities. Greenwich added the largest number of any city with 69 additional EVs since January.
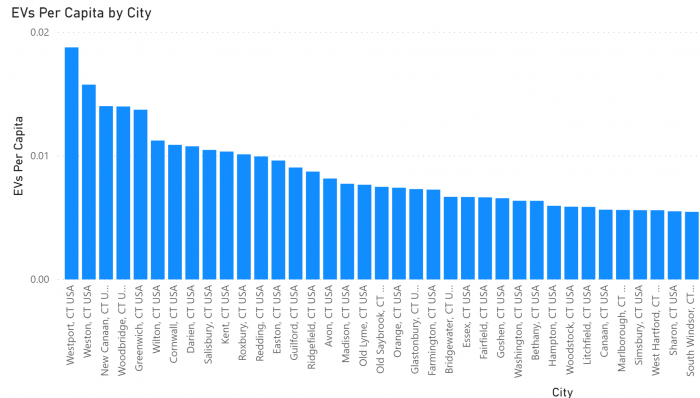
EVs Per Capita by City
Westport remains the leader in EVs per capita, followed by Weston, New Canaan, Woodbridge, and Greenwich. This screenshot is an excerpt of the top cities. The full list can be viewed in the dashboard (use the scroller).