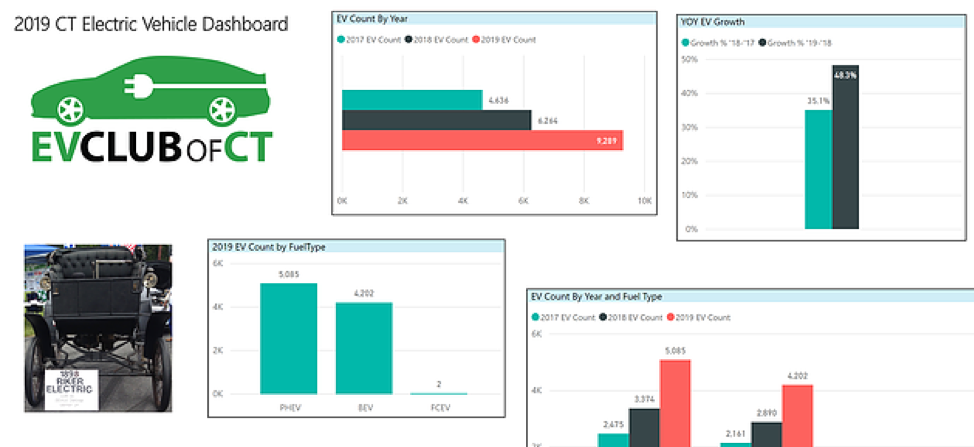
The newest version of the Electric Vehicle Interactive Dashboard has arrived.
Highlights
- EV growth was strong in 2018 but there is still a very long way to go to achieve the objectives set forth in the Multi-State ZEV Action plan.
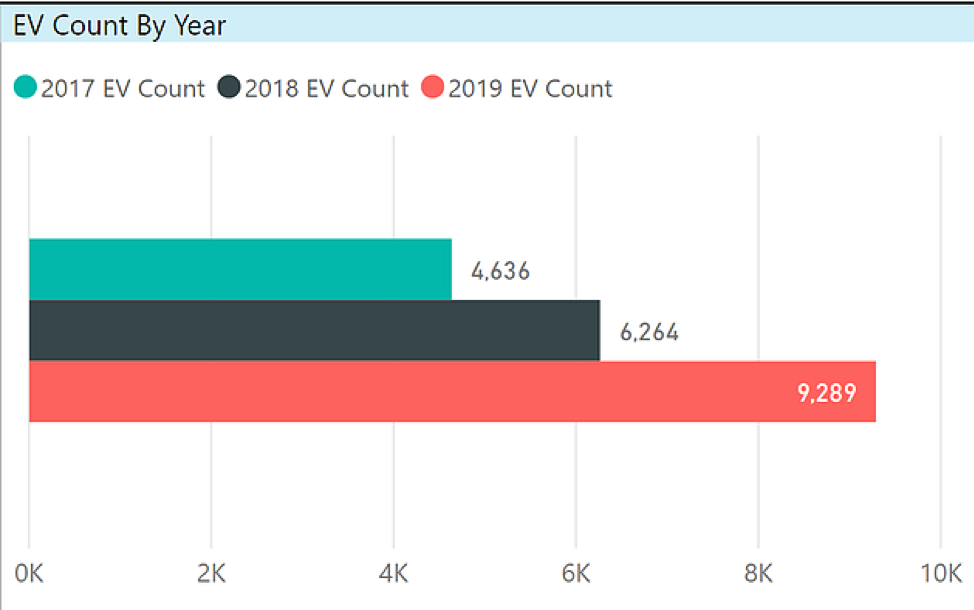
- There are 9,289 registered EVs in the state as of Jan 1, 2019, an increase of 78% from the year ago point in time.
- The increase was largely powered by the Tesla Model 3.
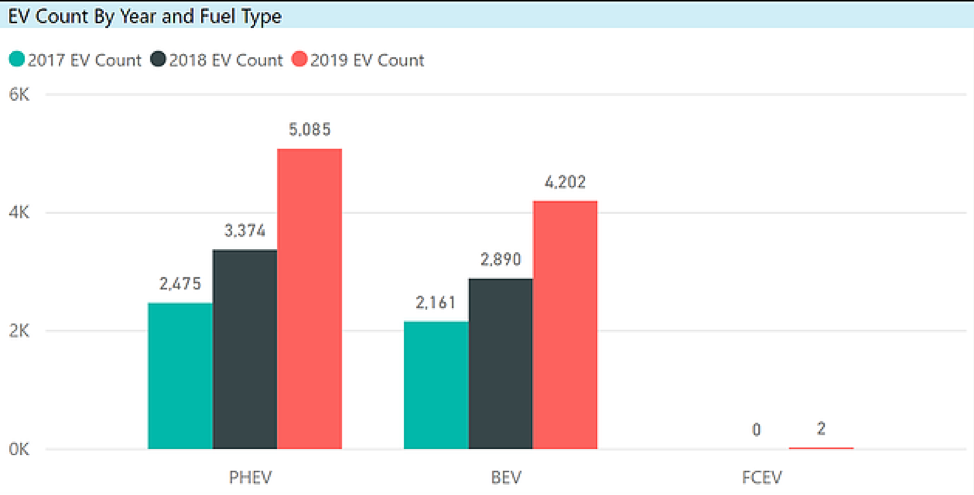
- Plug-in hybrid vehicles (PHEVs) still account for somewhat more than half of all registered EVs.
- The first fuel cell vehicles appeared in the state in 2018.
- Tesla, despite only selling high-priced vehicles, including the higher-priced version of the Model 3, accounts for 31% of all registered EVs.
- The most widely registered model is the plug-in version(s) of the Toyota Prius (combining the first-generation Plug-in Prius and the successor Prius Prime).
- 61% of registered EVs are from the 2017 or 2018 model year.
Introduction
While the DMV is required by statute to publish the number of EVs in CT every six months, they do not publish any sort of breakdown. It is simply a topline number that can be used to measure the overall progress relative to the goals adopted when the state joined the Multi-state ZEV Action Plan (MZAP). Unless one has the financial wherewithal to subscribe to one of the syndicated research services that process automobile registrations, this is the only place to see the breakdown of electric vehicles in CT.
The Electric Vehicle Club of Ct (EVClubCT) has received files from the Connecticut Department of Motor Vehicles for the past three years, and from this we have developed the Interactive EV Dashboard. This blog post summarizes the findings. At the end of this post is information about how to link directly to the dashboard.
Technical Notes
These files have come to us via Freedom of Information Act request, but the timing, the included fields, and format have varied across the years. We work with it as best we can. For example, the file this year did not include fuel type. Even when it did, in 2017 and 2018, the DMV does not have Plug-in Hybrid Vehicles (PHEV) codified as a fuel type. We build that from the model name. The topline numbers published by the DMV do include all EV fuel types, which are Battery Electric Vehicles (BEV), PHEV, and Fuel Cell Electric Vehicles (FCEV).
We have received files from February 2017, March 2018, and January 2019 (actually all vehicles registered as of December 31, 2018). This asynchronous timing, along with our manually applying the fuel type designation, will cause our numbers to be slightly different than the DMV.
The dashboard is simpler this year because we did not receive the city associated with each vehicle, nor did we receive totals to give us a denominator. Consequently, we could not update our analysis by city, county, median income, per capita, and percentage of the fleet. We have make, model, and model year only.
Definitions
The numbers are based on vehicle registrations. NOT SALES. This is the most often misunderstood point about this exercise. In other words, it is cumulative minus any turnover. Vehicles may have been acquired new or used, purchased or leased. Also, the model year is exactly that, the vehicle model year – not the year in which it was sold.
Overall Growth
This blog has published in February that the number of registered EVs grew 78% year over year in 2019. The growth during the 9-month interval covered by the dashboard is 48%. Either number is an improvement over the 35% from the prior year. But the improved growth rate still leaves a big gap between the 9,289 EVs currently registered and the MZAP objective of about 500,000 EVs by 2030. We would need a going forward compounded annual growth rate of about 44% to achieve this level. The growth rate was relatively strong this year with the most significant factor being the pent-up demand for the Model 3.
All of the charts below are from the data in the dashboard, which, as earlier noted, use months other than January for 2017 or 2018.
Fuel Type
PHEVs are still the more dominant fuel-type. At some point, we assume that BEVs will dominate and we note that General Motors has announced going forward that it will only produce BEVs. But the PHEV is an important transitional power-train. As noted by DEEP at their clean transportation forum on January 30, PHEVs have a big impact on reducing fossil fuels and will be with us for some time until infrastructure and battery technology can overcome range anxiety and limitations.
The first fuel cell vehicles have appeared in the file since we began doing this. There were – wait for it – drum roll — TWO! Both are the Toyota Mirai. Toyota, which is heavily invested in hybrids, seems to also be looking to develop FCEVs rather than BEVs. Their only BEV was the short-lived compliance vehicle BEV version of the RAV4. If you think EV charging infrastructure is inadequate, well, there are currently as many refueling options for FCEVs as there are vehicles. No waiting! When last we checked, there was one in Hartford and one in Wallingford. FCEVs are true zero tailpipe emissions vehicles (and like with electricity, there is a variable carbon footprint depending upon how the hydrogen is manufactured). The CT purchase incentive program, CHEAPR, offers a $5,000 rebate for FCEVs, larger than for the other vehicle types. Though there are complaints about the lack of EV charging stations, it is about the hardware and not the power source, as the grid is ubiquitous. That is the nature of the infrastructure challenge facing hydrogen power, along with the high cost of the cars.
Make
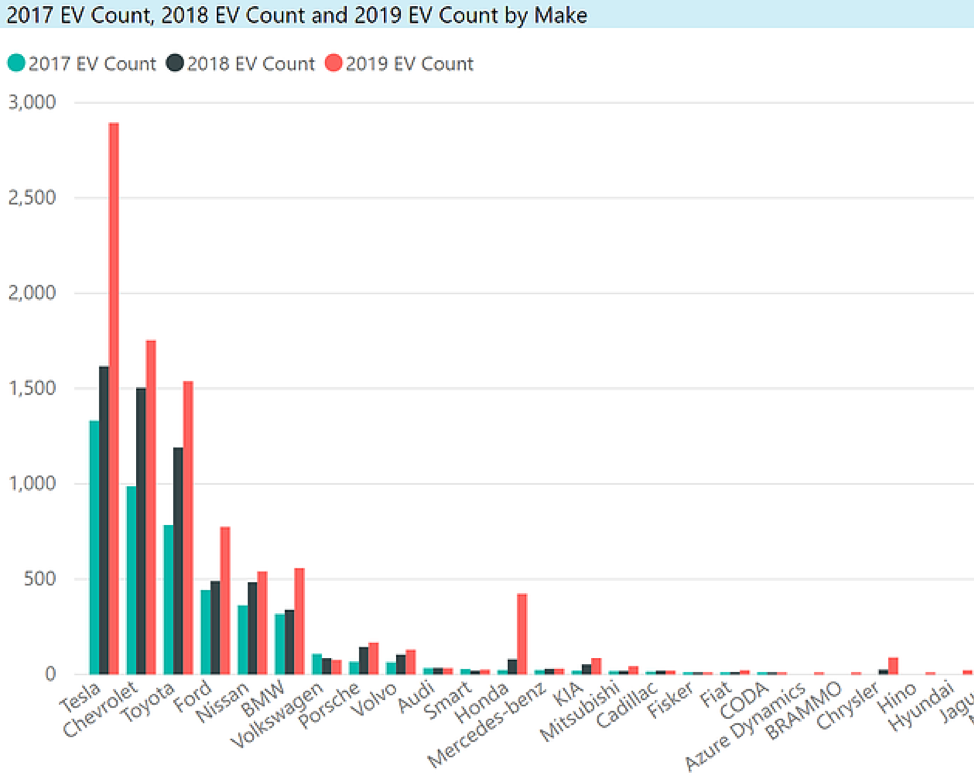
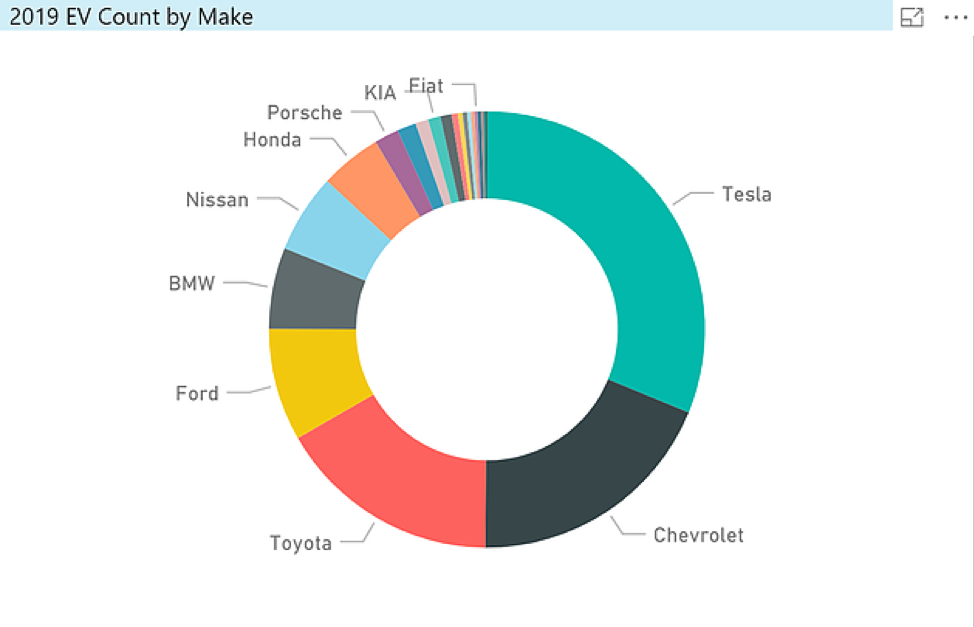
Tesla, despite CT not allowing them to open stores in the state, has widened its lead, increasing from 26% to 31% of all registered EVs. 2,894 of the 9,289 EVs are Tesla. The only two other makes to exceed 10% in share are Chevrolet (19%) and Toyota (17%), with Toyota growing at a faster rate than Chevy. Below is an excerpt of the chart showing the 3-year trend by make, and below that, a donut chart showing the vehicle count as a share of the total.
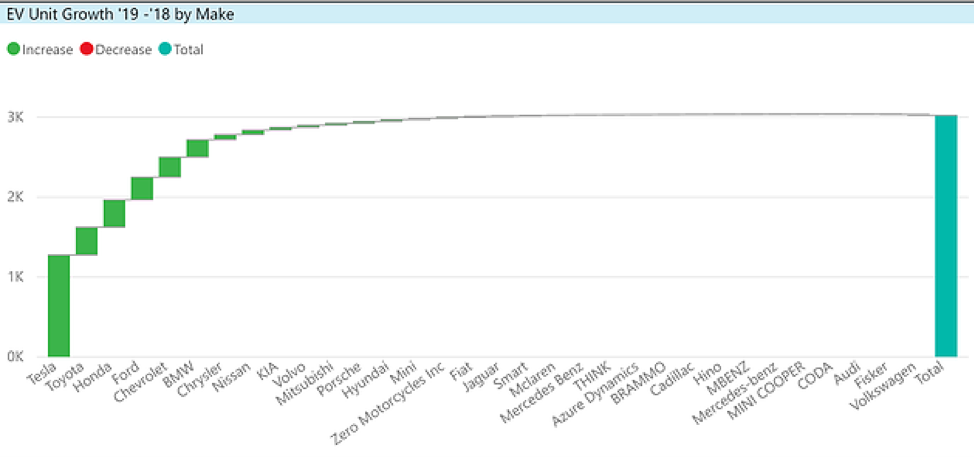
% Of Growth By Make
Tesla was responsible for 42% of the unit growth, followed by Toyota and Honda, both at 11%. The vast majority of automakers were responsible for less than 1% of the growth each.
Model
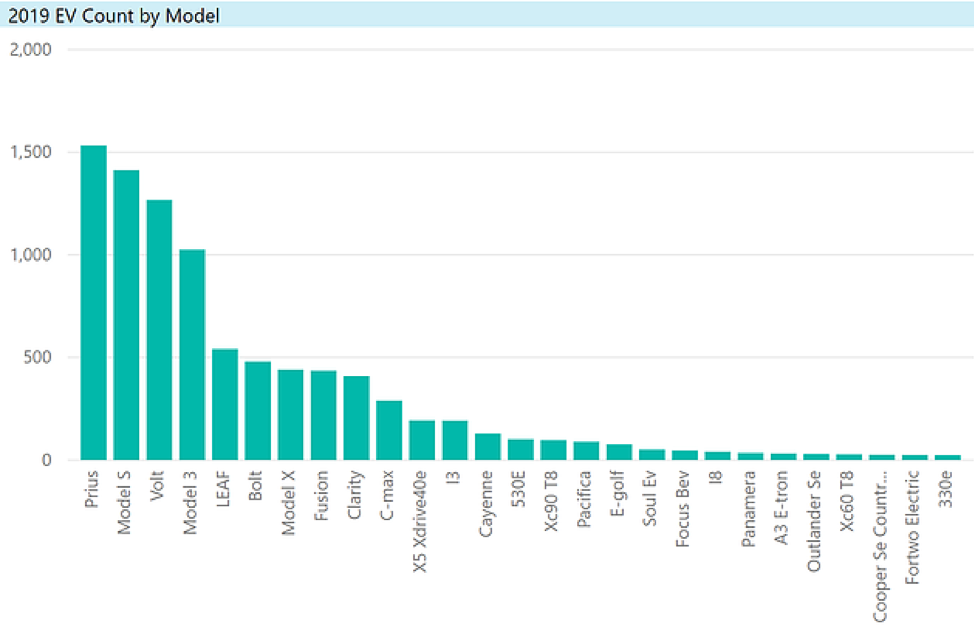
As noted earlier, the Model 3 was the big story, with 1,025 units registered in CT in 2018, placing it fourth in terms of number of vehicles registered following the Prius (1,533), Model S (1,413), and Volt (1,267). These are the only vehicles with over 1,000 registrations. The Leaf and Bolt follow. One other new car made a modest splash, the PHEV version of the Honda Clarity, now with 409 units registered in 2018. Below is an excerpt.
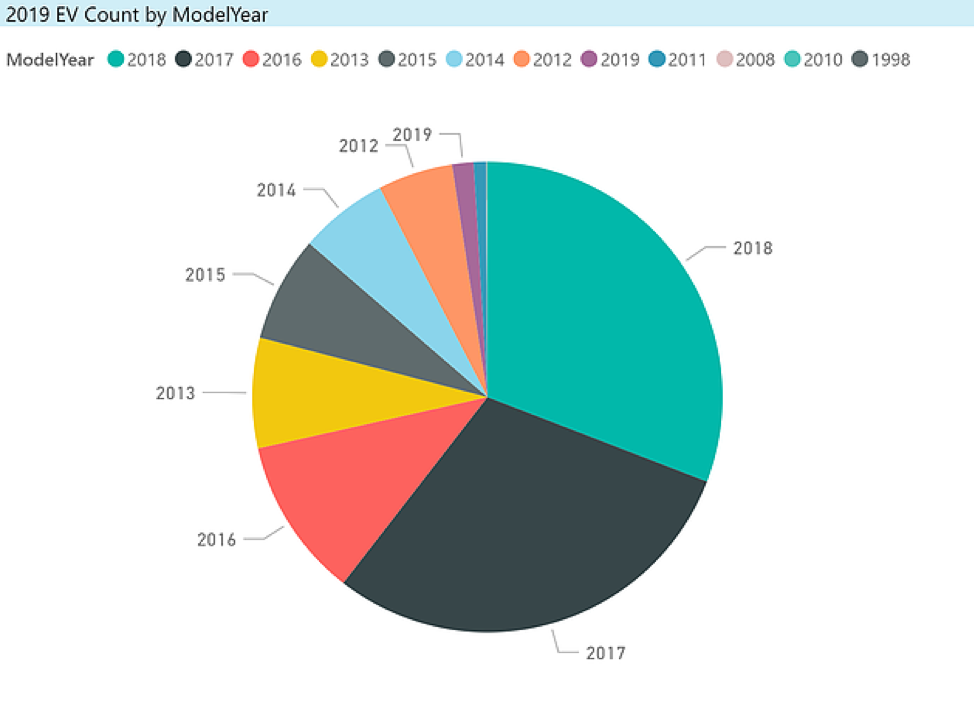
Model Year
It isn’t surprising that most EVs are of the 2017 and 2018 model years. There were a few 2019 models that sneaked in at the end of the year. If you look at the legend below, you might find it surprising that there is an EV from 1998. It is actually a Ford Ranger. That’s all we know. Is it some one-of-a-kind DIY thing? Or an error in the file (it happens)? We’ll leave it there.
Closing Thoughts
- While EV ownership had strong growth in 2018, there is a long way to go to reach the MZEV goals.
- Early signs are pointing to a slower growth year in 2019. EV sales nationally grew 11% in the first quarter of 2019 relative to 2018. (And in Q1 2018, the Model 3 had not yet scaled.) This compares to growth of 81% for the full year of 2018 over 2017. There are relatively few new near-term EV introductions. Among them are a refreshed Leaf with a 150 mile range, the Kia Niro rated for 239 miles, Hyundai Kona rated for 258 miles, 200+ mile luxury vehicles in the Audi E-Tron and the recently introduced Jaguar I-Pace. Tesla will begin producing the lower cost version of the Model 3 and may possibly offer a lease option later this year. Deliveries of the Model Y from Tesla, expected to be another significant launch, will not begin until late 2020, assuming it remains on schedule. GM has canceled the Volt, a fairly large seller by EV standards, and announced a pivot towards a BEV only strategy centered under the Cadillac brand which will take a few years to become manifest.
- The EV Club was advocating for HB 7142, which would have permitted direct sales by a manufacturer without a dealer network (i.e. Tesla at this point in time). While Tesla’s announcement of a move to an Internet sales model has mooted this, the fact remains that this company has an outsize presence in the EV market in the state, though likely it could have been larger. This sales model may also be a consideration for prospective new entrants in the EV space.
- There were a couple of other bright spots outside of Tesla, mainly the Toyota Prius Prime and the Honda Clarity (PHEV version, which has an electric range only slightly below the Volt), but most of the automobile manufacturers are not generating much EV sales volume at this time.
- Both Tesla and GM are in the Federal Tax Credit phase-out period. Many of the newly announced EVs are a few years away from being available.
- Fuel prices have remained fairly low.
- There are a number of policies that the club advocates. Here are some important ones:
- The CT CHEAPR rebate program does not have an ongoing source of funding and could run out this year.
- We advocate the Federal Tax Credit be continued, preferably turned into a rebate, and that the 200,000 unit cap per manufacturer be removed.
- Building codes should be updated to require pre-wiring for EV chargers, with particular attention to multi-unit dwellings.
- Better time-of-use electrical rates.
- Incorporation of EVs in public sector fleets.
- Policies that de-carbonize the grid.
- While there are some encouraging signals, including a study from AAA indicating that one in five drivers say they are likely to go electric for their next vehicle purchase, this is no time to take our foot off the “gas.”
The browser version of the dashboard is available here
There is a Powerpoint, obviously not interactive, of the dashboard visuals downloadable from the home page.
If any reader would like access to the PBI.com version, let us know via the website contact form.