EV Incidence and Political Party Registrations by City
As this is being written on Election Day, and with an enormous chasm between the environmental/climate change plans of the two presidential candidates, we thought it a good time to look at how EVs fit into the CT political landscape based on voter registration in Connecticut.
I do not have data at the individual person level. I am working with counts at the city level – of EVs, median household income, and voter registration.
The most highly-correlated factor with respect to EVs is income. With Tesla the dominant, and pricey, make, EVs still carrying a higher cost than ICE generally, and limited supply of affordable used EVs, that isn’t surprising. Also, there is still a significant lack of access to charging in our more urban areas with many people living in multiple unit dwellings. For that reason, in the charts below, I have filtered out the roughly one-third of cities with a median household income of <$75K in order to obtain a sharper focus on the political registrations.
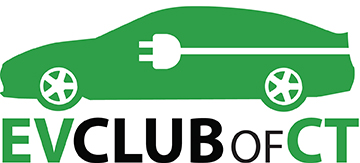
The chart at the top shows EV incidence and voter registration counts by party by city. The bars are all the same size because they total back to 100%. The variations in proportions by each color are driven by the proportion of voter registrations, which come from CT.gov, by party. Red and blue are obvious. The gold represents both independents and minor party registrations. Minor parties are a very small part of that grouping. The line shows EVs as a percentage of all vehicles within each city.
This screengrab is an excerpt. The full chart has been added to the EV Dashboard.
Bipartisan presence of EVs
There is not a significant correlation between voter registration profile and EV incidence. The two top EV cities, Westport and Weston, are Democratic redoubts. The next two cities are New Canaan, where registered Republicans outnumber Democrats by 2:1, and Greenwich which also has a Republican skew. This is followed by Wilton, which is evenly divided, and then Darien, which has a similar profile to New Canaan. We regard this bipartisan profile to be encouraging and feel that this, and the environment in general, shouldn’t be a partisan issue.
2016 Election Profile
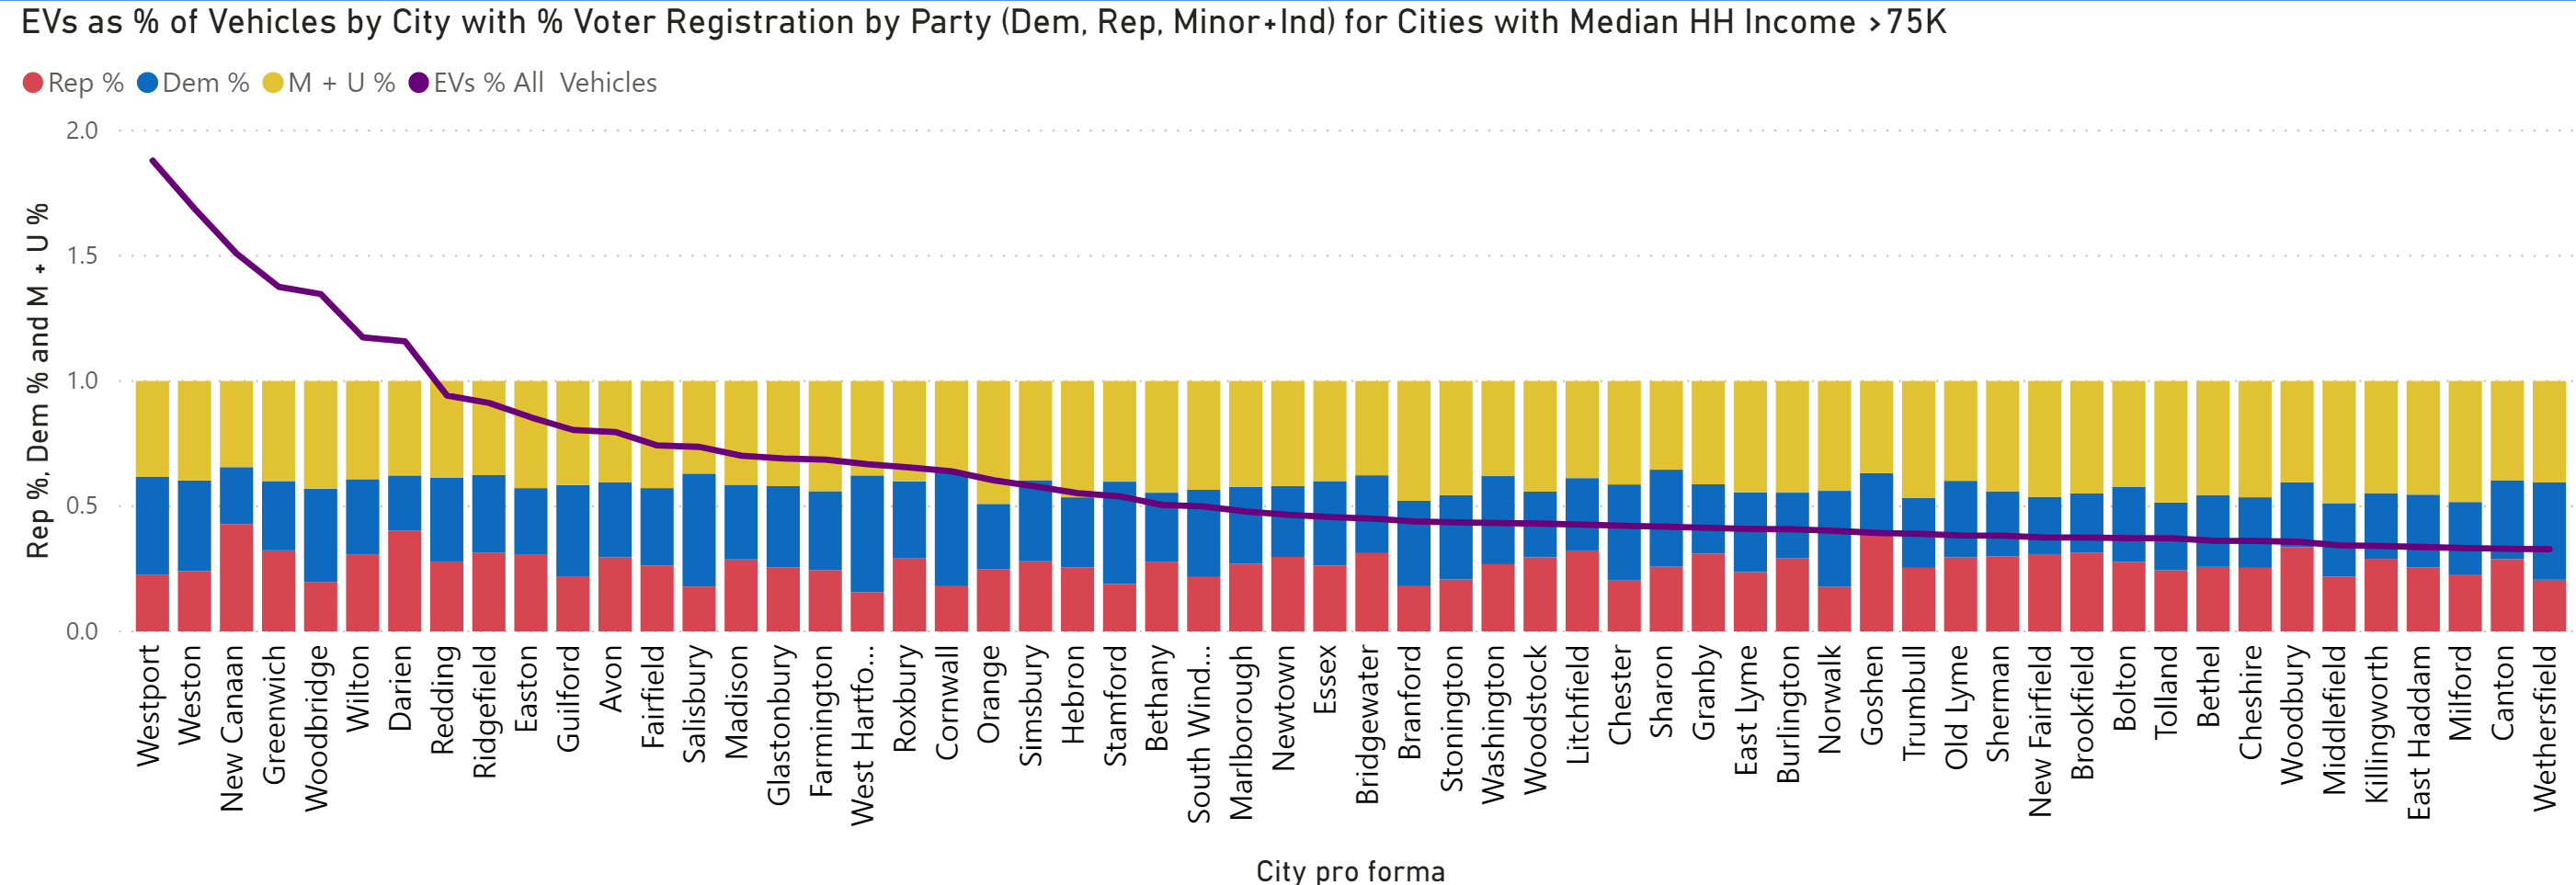
CT is a blue state and voted for Clinton in 2016. The two charts below filter the chart by which cities voted for Clinton vs. Trump. The hypothesis was that the profiles might be more extreme than overall registration, and that turns out to be the case. (The income filter remains in these two charts.)
Looking at the data this way, as presumably, Trump won the most conservative cities, a clear difference emerges with much higher EV incidence in Clinton cities, including Republican-dominant cities that voted for Clinton.
Clinton Cities 2016
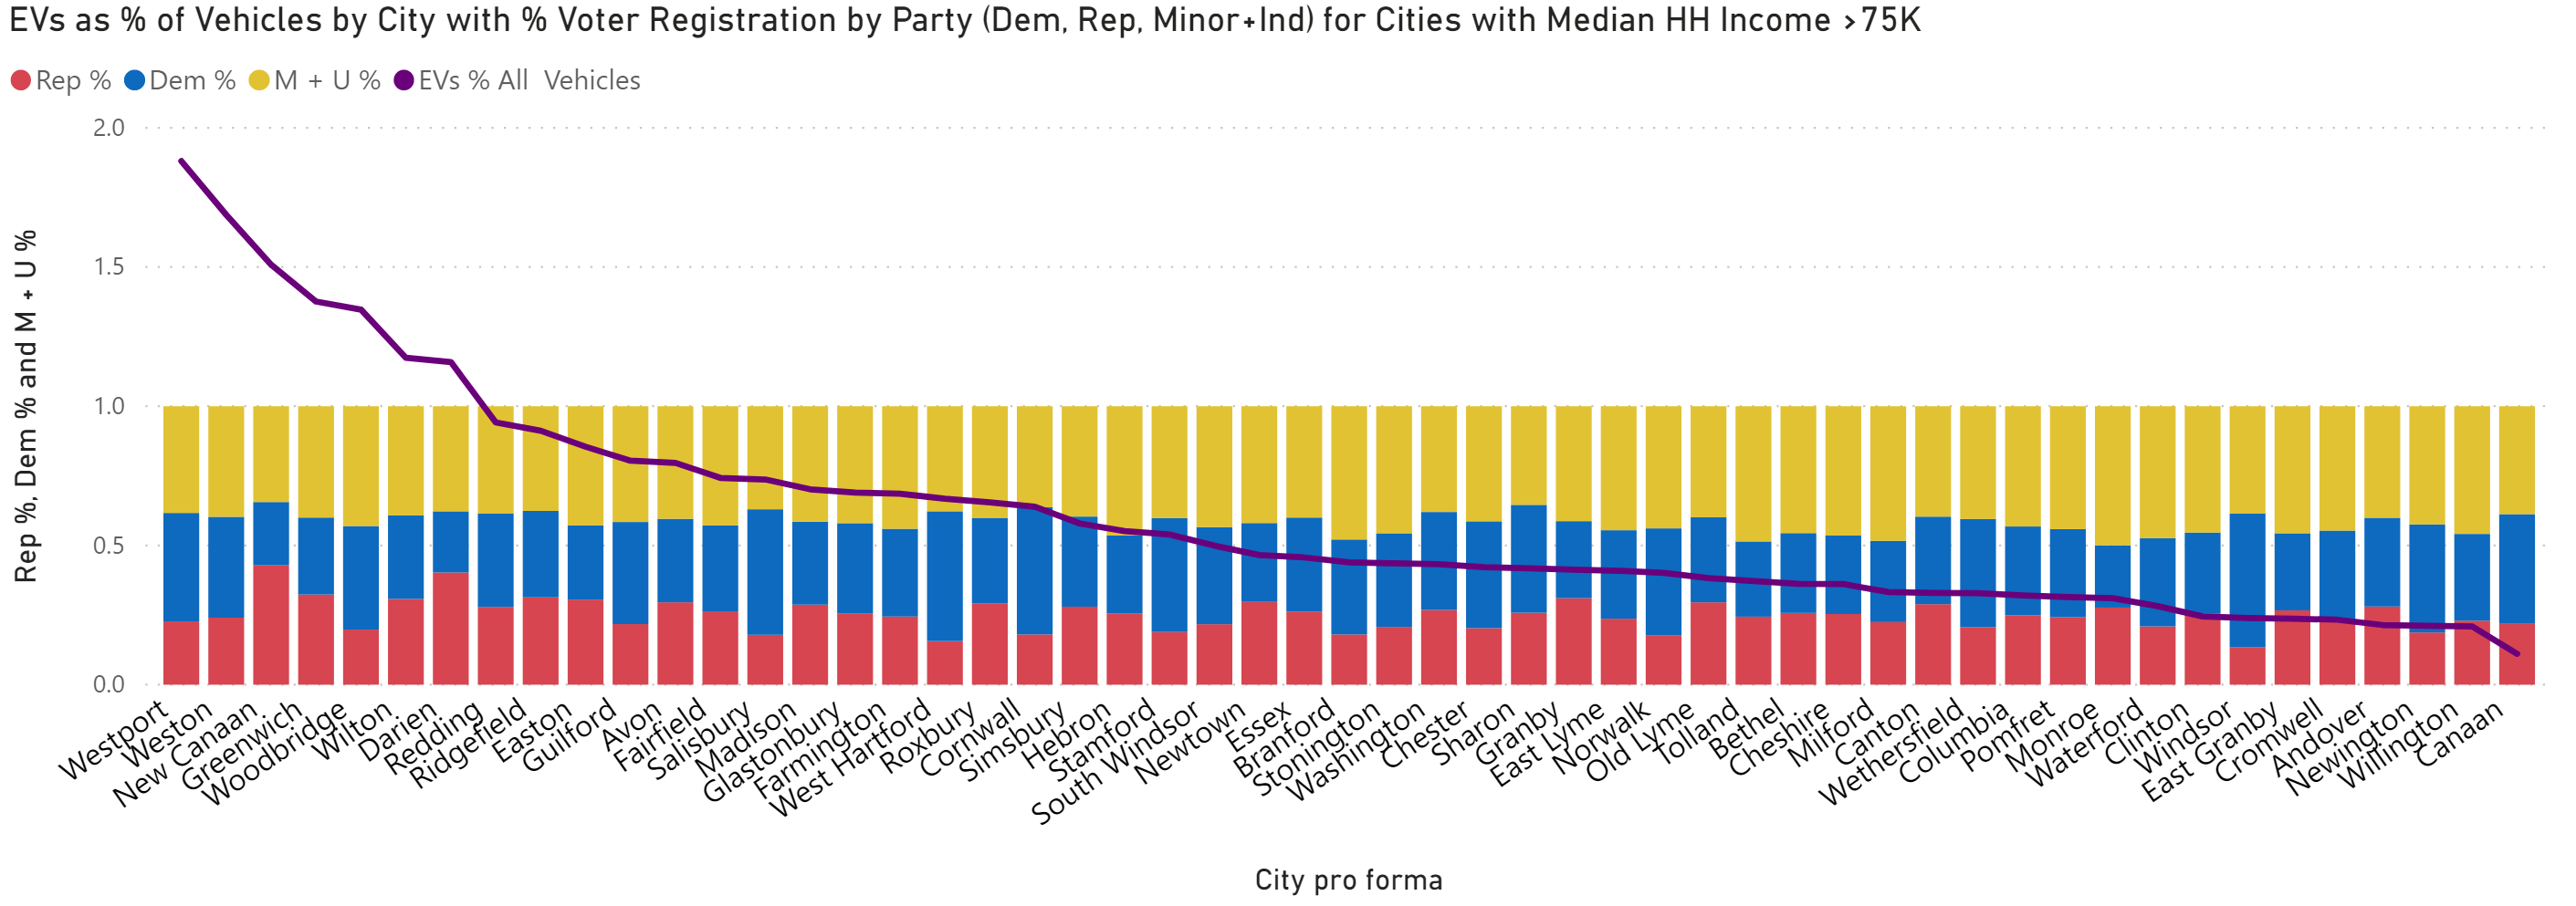
Trump Cities 2016
Looking at the data this way, as presumably, Trump won the most conservative cities, a clear difference emerges with much higher EV incidence in Clinton cities, including Republican-dominant cities that voted for Clinton.