CT EV Ownership Up 16% in First Half of 2019

Interactive EV Dashboard – July 2019 Update

The Department of Motor Vehicles has released its semi-annual update of EV ownership in the State of Connecticut. The update is dated July 1. The DMV only publishes the total on its website. We have obtained a detailed file to analyze the profile of EV ownership in CT. This is a file of all light-vehicle EV registrations. It is not new vehicle sales. It includes both purchased and leased vehicles, whether acquired new or used. It reflects newly acquired vehicles, less any turnover. There were 2136 EVs registered in the first half of 2019, but with a turnover of 628 vehicles, the net increase is 1508.

There is no PII. We received make, model, model year, fuel type, and zip code. We added in census data for population by city and median household income by city. The zip code reflects where the vehicle is registered, which could, in some cases, be different than where it is garaged.

This blog post summarizes some of the highlights and uses screenshots, which are not interactive. This link will take you to the browser version of the dashboard, which has the interactivity. Note: pagination is at the bottom of each page. The dashboard also lives on PBI.com, which we can link you to upon request.

Feel free to contact the club with any questions!

Growth

There are now 10,797 EVs registered in CT, an increase of 16% from Jan 2019. This is not a great number. It paces below the CAGR of about 40% that is necessary (based on the Jan. 1 number) to meet the goals outlined in the ZEV Multistate Action Plan. (Granted, this slower growth is occurring against a backdrop of slowing automobile sales generally.)

Number of EVs registered in CT
Chart: Barry Kresch


EV Growth Rate, EV Club CT
Chart: Barry Kresch

Fuel Type

53% of EVs are of the Plug-in Hybrid (PHEV) variety. Battery Electric Vehicles (BEV) are growing at a faster rate, mainly due to Tesla. However, the great majority of EV offerings from most other manufacturers are PHEVs, which is driving this. We expect the balance will change in a few years. BEMC refers to Battery Electric Motorcycles, and FCEV refers to Fuel Cell EVs.

EV Trend in CT by Fuel Type, EV Club of CT

Make

The story this year, much like last year, was that most of the growth was driven by Tesla. This is despite whatever sales friction exists due to CT still being among the handful of states that do not allow Tesla to open their own stores, and, of course, Tesla being in the phase-out of the Federal Tax Credit. Hyundai had a modest pop. All of the other manufacturers were either treading water or had lost ground. Honda, which had a boost last year with the PHEV Clarity, has flattened. There is a report in Inside EVs that Honda has pulled back on distribution and is now selling it only in California. The two makes that lost the most ground were Chevrolet and Ford. The chart excerpt below shows the trend of registered EVs by make for the four data points we have going back to 2017. The chart is an excerpt and includes those with the highest numbers as of July 2019.

EV Trend by Make in CT, EV Club of CT
Chart: Barry Kresch

Tesla now accounts for 34% of EVs registered in the state. As recently as 2018, the numbers for Tesla, Chevrolet, and Toyota were close, but that is no longer the case.

7-19 EV Share by Make, EV Club of CT
Chart: Barry Kresch

This waterfall chart looks at the contribution to incremental growth between January and July by make. Tesla was responsible for 52% of net EV growth. This was an increase of 780 units out of the net growth of 1508. Hyundai accounted for 32%. All other makes ranged from slightly below 4% to -4%.

EV Growth Contribution by Make in CT, Ev Club of CT

Model

The Tesla Model 3 is now the most widely registered Model, less than 2 years after it became available. And, as one can see from the jump in the size of the bar, it is THE story in the EV world for the past 12 months. It is a great early success story, has overwhelmed every other model, and has arguably been something of a double-edged sword for Tesla as the growth of the Models S and X has slowed (more so the S).

The Prius Plug-in is second. (Note: The Prius numbers combine the gen 1 Plug-in Prius with the newer, and better selling, Prius Prime.) In the third position is the Model S, followed by the Chevy Volt. With the discontinuance of the Volt in March 2019, the sales of this model are drastically reduced as GM clears out remaining inventory. On this chart, the number of Volts shows a decline since January, meaning that turnover is greater than newly acquired vehicles being registered. This chart is also an excerpt of the most widely registered models as there are too many to display here.

EV Trend by Model in CT, EV Club CT

EVs by City/County

The cities with the highest number of EVs are Stamford (524), Greenwich (489), Westport (431), Fairfield (316), and Norwalk (296). The chart below is an excerpt of the cities with the most EVs.

Fairfield County, in general, is where the largest concentration of EVs can be found, accounting for 40% of EVs in the state.

EV Count by City, CT. EV Club of CT
Chart: Barry Kresch

EV Count by CT County
Chart: Barry Kresch

Per-Capita

On a per-capita basis, Westport is the leading city, followed by Weston, New Canaan, Woodbridge, and Wilton. The chart below is also an excerpt due to space limitations.

EVs per capita by city in CT, EV Club of CT
Chart: Barry Kresch

In the chart below, the size of the bubble reflects the count of EVs and the coloration is based on per-capita. The darkest blue-green has the highest per-capita and the deepest red is the lowest.

Visualization of number of EVs and EVs per capita by city in CT, EV Club of CT
Chart: Barry Kresch

EVs by Zip Code

The final map displays EVs by zip code. Yes, the chart is dense where the populatioin is dense, and it reinforces what we already know from the cities, but gives added granularity. Notice how adjacent zip codes in Fairfield County span the highest to lowest levels of EV representation.

EVs in CT by Zip Code
Chart: Barry Kresch


Sierra Club to Present at 5/28 EV Club Meeting

The EV Club of CT is pleased to announce that there will be a presentation from Hieu Le of the Sierra Club at the upcoming club meeting, scheduled for May 28th. The Sierra Club is one of the organizations that EV Club CT partners with in the Connecticut Electric Vehicle Coalition.


Hieu Le is the campaign representative for the Sierra Club’s Clean Transportation for all Campaign. He leads the organization’s efforts on the Volkswagen settlement funds, electric vehicles, EV fees, National Drive Electric Week, and the Rev Up Electric Vehicles campaign. Prior to joining the Sierra Club, he worked on Beto O’Rourke’s Senate campaign in Texas. He also worked in Sacramento for a government affairs firm. He is a former delegate to the California Democratic Party and attended the University of California, Santa Barbara.


Meeting logistics

Date: May 28th

Time: 7:00 PM

Location: Bedford Square Offices of The Higgins Group, 30 Elm Street, Westport, CT.


Dashboard Redux – 2019

The newest version of the Electric Vehicle Interactive Dashboard has arrived.


Highlights

  • EV growth was strong in 2018 but there is still a very long way to go to achieve the objectives set forth in the Multi-State ZEV Action plan.
  • There are 9,289 registered EVs in the state as of Jan 1, 2019, an increase of 78% from the year ago point in time.
  • The increase was largely powered by the Tesla Model 3.
  • Plug-in hybrid vehicles (PHEVs) still account for somewhat more than half of all registered EVs.
  • The first fuel cell vehicles appeared in the state in 2018.
  • Tesla, despite only selling high-priced vehicles, including the higher-priced version of the Model 3, accounts for 31% of all registered EVs.
  • The most widely registered model is the plug-in version(s) of the Toyota Prius (combining the first-generation Plug-in Prius and the successor Prius Prime).
  • 61% of registered EVs are from the 2017 or 2018 model year.

Introduction

While the DMV is required by statute to publish the number of EVs in CT every six months, they do not publish any sort of breakdown. It is simply a topline number that can be used to measure the overall progress relative to the goals adopted when the state joined the Multi-state ZEV Action Plan (MZAP). Unless one has the financial wherewithal to subscribe to one of the syndicated research services that process automobile registrations, this is the only place to see the breakdown of electric vehicles in CT.

The Electric Vehicle Club of Ct (EVClubCT) has received files from the Connecticut Department of Motor Vehicles for the past three years, and from this we have developed the Interactive EV Dashboard. This blog post summarizes the findings. At the end of this post is information about how to link directly to the dashboard.

Technical Notes

These files have come to us via Freedom of Information Act request, but the timing, the included fields, and format have varied across the years. We work with it as best we can. For example, the file this year did not include fuel type. Even when it did, in 2017 and 2018, the DMV does not have Plug-in Hybrid Vehicles (PHEV) codified as a fuel type. We build that from the model name. The topline numbers published by the DMV do include all EV fuel types, which are Battery Electric Vehicles (BEV), PHEV, and Fuel Cell Electric Vehicles (FCEV).

We have received files from February 2017, March 2018, and January 2019 (actually all vehicles registered as of December 31, 2018). This asynchronous timing, along with our manually applying the fuel type designation, will cause our numbers to be slightly different than the DMV.

The dashboard is simpler this year because we did not receive the city associated with each vehicle, nor did we receive totals to give us a denominator. Consequently, we could not update our analysis by city, county, median income, per capita, and percentage of the fleet. We have make, model, and model year only.

Definitions

The numbers are based on vehicle registrations. NOT SALES. This is the most often misunderstood point about this exercise. In other words, it is cumulative minus any turnover. Vehicles may have been acquired new or used, purchased or leased. Also, the model year is exactly that, the vehicle model year – not the year in which it was sold.

Overall Growth

This blog has published in February that the number of registered EVs grew 78% year over year in 2019. The growth during the 9-month interval covered by the dashboard is 48%. Either number is an improvement over the 35% from the prior year. But the improved growth rate still leaves a big gap between the 9,289 EVs currently registered and the MZAP objective of about 500,000 EVs by 2030. We would need a going forward compounded annual growth rate of about 44% to achieve this level. The growth rate was relatively strong this year with the most significant factor being the pent-up demand for the Model 3.

Trend of EV registrations in CT

All of the charts below are from the data in the dashboard, which, as earlier noted, use months other than January for 2017 or 2018.

Fuel Type

PHEVs are still the more dominant fuel-type. At some point, we assume that BEVs will dominate and we note that General Motors has announced going forward that it will only produce BEVs. But the PHEV is an important transitional power-train. As noted by DEEP at their clean transportation forum on January 30, PHEVs have a big impact on reducing fossil fuels and will be with us for some time until infrastructure and battery technology can overcome range anxiety and limitations.

The first fuel cell vehicles have appeared in the file since we began doing this. There were – wait for it – drum roll — TWO! Both are the Toyota Mirai. Toyota, which is heavily invested in hybrids, seems to also be looking to develop FCEVs rather than BEVs. Their only BEV was the short-lived compliance vehicle BEV version of the RAV4. If you think EV charging infrastructure is inadequate, well, there are currently as many refueling options for FCEVs as there are vehicles. No waiting! When last we checked, there was one in Hartford and one in Wallingford. FCEVs are true zero tailpipe emissions vehicles (and like with electricity, there is a variable carbon footprint depending upon how the hydrogen is manufactured). The CT purchase incentive program, CHEAPR, offers a $5,000 rebate for FCEVs, larger than for the other vehicle types. Though there are complaints about the lack of EV charging stations, it is about the hardware and not the power source, as the grid is ubiquitous. That is the nature of the infrastructure challenge facing hydrogen power, along with the high cost of the cars.

EV Trend by fuel type

Make

Tesla, despite CT not allowing them to open stores in the state, has widened its lead, increasing from 26% to 31% of all registered EVs. 2,894 of the 9,289 EVs are Tesla. The only two other makes to exceed 10% in share are Chevrolet (19%) and Toyota (17%), with Toyota growing at a faster rate than Chevy. Below is an excerpt of the chart showing the 3-year trend by make, and below that, a donut chart showing the vehicle count as a share of the total.

EV trend by make

Share of EVs by Make

% Of Growth By Make

Tesla was responsible for 42% of the unit growth, followed by Toyota and Honda, both at 11%. The vast majority of automakers were responsible for less than 1% of the growth each.

EV growth year over year by make

Model

As noted earlier, the Model 3 was the big story, with 1,025 units registered in CT in 2018, placing it fourth in terms of number of vehicles registered following the Prius (1,533), Model S (1,413), and Volt (1,267). These are the only vehicles with over 1,000 registrations. The Leaf and Bolt follow. One other new car made a modest splash, the PHEV version of the Honda Clarity, now with 409 units registered in 2018. Below is an excerpt.

CT EVs by model

Model Year

It isn’t surprising that most EVs are of the 2017 and 2018 model years. There were a few 2019 models that sneaked in at the end of the year. If you look at the legend below, you might find it surprising that there is an EV from 1998. It is actually a Ford Ranger. That’s all we know. Is it some one-of-a-kind DIY thing? Or an error in the file (it happens)? We’ll leave it there.

EV Count by model year


Closing Thoughts

  • While EV ownership had strong growth in 2018, there is a long way to go to reach the MZEV goals.
  • Early signs are pointing to a slower growth year in 2019. EV sales nationally grew 11% in the first quarter of 2019 relative to 2018. (And in Q1 2018, the Model 3 had not yet scaled.) This compares to growth of 81% for the full year of 2018 over 2017. There are relatively few new near-term EV introductions. Among them are a refreshed Leaf with a 150 mile range, the Kia Niro rated for 239 miles, Hyundai Kona rated for 258 miles, 200+ mile luxury vehicles in the Audi E-Tron and the recently introduced Jaguar I-Pace. Tesla will begin producing the lower cost version of the Model 3 and may possibly offer a lease option later this year. Deliveries of the Model Y from Tesla, expected to be another significant launch, will not begin until late 2020, assuming it remains on schedule. GM has canceled the Volt, a fairly large seller by EV standards, and announced a pivot towards a BEV only strategy centered under the Cadillac brand which will take a few years to become manifest.
  • The EV Club was advocating for HB 7142, which would have permitted direct sales by a manufacturer without a dealer network (i.e. Tesla at this point in time). While Tesla’s announcement of a move to an Internet sales model has mooted this, the fact remains that this company has an outsize presence in the EV market in the state, though likely it could have been larger. This sales model may also be a consideration for prospective new entrants in the EV space.
  • There were a couple of other bright spots outside of Tesla, mainly the Toyota Prius Prime and the Honda Clarity (PHEV version, which has an electric range only slightly below the Volt), but most of the automobile manufacturers are not generating much EV sales volume at this time.
  • Both Tesla and GM are in the Federal Tax Credit phase-out period. Many of the newly announced EVs are a few years away from being available.
  • Fuel prices have remained fairly low.
  • There are a number of policies that the club advocates. Here are some important ones:
    • The CT CHEAPR rebate program does not have an ongoing source of funding and could run out this year.
    • We advocate the Federal Tax Credit be continued, preferably turned into a rebate, and that the 200,000 unit cap per manufacturer be removed.
    • Building codes should be updated to require pre-wiring for EV chargers, with particular attention to multi-unit dwellings.
    • Better time-of-use electrical rates.
    • Incorporation of EVs in public sector fleets.
    • Policies that de-carbonize the grid.
  • While there are some encouraging signals, including a study from AAA indicating that one in five drivers say they are likely to go electric for their next vehicle purchase, this is no time to take our foot off the “gas.”

The browser version of the dashboard is available here

There is a Powerpoint, obviously not interactive, of the dashboard visuals downloadable from the home page.

If any reader would like access to the PBI.com version, let us know via the website contact form.


SRO Crowd For Clean Transportation Forum In Hartford

Representative Jonathan Steinberg (D-136) Kicks Off The Session By Advocating for Added CHEAPR Funding (Photo: Bruce Becker)

Hartford DEEP Transportation Forum
REp. Jonathan Steinberg (D-136) Kicks off the Session By Advocating Continued CHEAPR Funding


Presenters: Dana Lowell (not pictured) of MJ Bradley and Associates; (left to right) Emily Lewis, Policy Analyst for Acadia Center; Mustafa Salahuddin, president of the Amalgamated Transit Union Local 1336 in Bridgeport; and Kevin Killer, Director of Public Policy for Chargepoint

A full house

A full meeting room of people assembled to hear a panel on EV public policy, specifically the economic benefits of moving to more extensive EV adoption. Along with the panelists noted above, the crowd also heard from Representatives Jonathan Steinberg (D-136, Westport) and Roland Lemar (D-96, East Haven), who is co-chair of the Transportation Committee. The panel was co-moderated by Claire Coleman, climate attorney for the CT Fund for the Environment, and Bruce Becker, president of the Electric Vehicle Club of CT.

The topic of the panel was how increased adoption of EVs will confer significant economic benefits to the state of CT and its residents.

Among the specific topics covered were continued funding of CHEAPR, the state program of rebates for EV purchasers; time-of-use utility rates; the impact of EV charging on utilities and ratepayers; and the benefits of moving to electric buses in our transit systems. For example, Mr. Lowell pointed out that, by law, the additional net revenues that would flow to utilities from EVs plugging in would have to be returned to ratepayers, lowering bills by an average of about $150 annually. And, if the charging were to occur primarily during off-peak hours, this would contribute to smoothing the power-utilization curve throughout the day. A good summary of the proceedings can be found in a write-up done by The Day of New London.

The EV Club of CT showed up in force for the day’s events, which included meetings with legislators and legislative aides in addition to the forum. Aside from Becker, club members Phil Levieff, Dawn Henry, R. Murali, Demetri Spantidos, Analiese Paik, Virgil de la Cruz, and Barry Kresch made the rounds.

Barry Kresch, Analiese Paik, R. Murali in Hartford
Barry Kresch, Analiese Paik, and R. Murali walked to the state capitol on a balmy, 24-degree morning on January 30. (Photo: Phil Levieff)


EV Ownership In CT Increases 78% in 2018

The early data are in and the number of EVs registered in CT as of December 31, 2018 has increased by 78% relative to one year ago.

We do not have much detail below this high-level information, but we know a few things and can surmise more.

The total number of EVs registered as of 12/31 is 9289, up from 5206 one year ago. There were 5063 PHEVs registered and 4208 BEVs. (This doesn’t 100% tie back due to a few outliers). The PHEV number was up 69% and the BEV number was up 91% relative to 2017.

Even though we do not have granular data, we know that 2018 was the year of the Tesla Model 3. The large increase and higher proportion of BEVs relative to past years is no doubt due to the Model 3, which has blasted through all previous EV sales records. Our opinion is that this number is also possibly a bit understated. There is a lead-lag to getting a Tesla registered in CT due to the fact that it is still not legal for Tesla to open stores in CT. Consequently, Teslas must be purchased out of state and then the registration has to be transferred. We have one member of our club who was upset that the transference did not occur until after Jan. 1, which cost him part of his tax credit. It is likely he was not alone.

Below is a chart that shows the difference in EV sales by make in 2018 relative to 2017. It is based on analysis of national data published in Inside EVs.chart - change in EV unit sales by make

Our club is brand agnostic. We want to see people buy EVs and we don’t care which one they choose. The change for Tesla is obviously light years ahead of every other company. But the bigger point, or question, is about the lack of traction on the part of all of the other manufacturers. It looks like they aren’t really trying and we hope that can change. Almost all of them have made numerous and ambitious announcements of EVs in development. Audi has purchased a 60 second spot in the Super Bowl to advertise EVs. Based on the going rate, they will have spent over $10 million for the privilege.

The legacy automakers will argue that their inability to generate EV sales momentum is due to lack of consumer interest exacerbated by relatively low fuel prices. Tesla is demonstrating that this is not the case (and doing so with a form factor – a sedan – that has been falling out of favor with consumers).

When one sees numbers like these, and being aware of the aggressive EV adoption goals in the Multistate ZEV Action that CT has signed on to, it is hard to justify throwing up barriers that inhibit sales by Tesla or other companies which sell direct, such as Rivian, the maker of an electric pickup.

We hope that Audi is throwing down a marker, and we hope the other companies follow through in a serious way on their EV pronouncements. In the meantime, enabling Tesla and other new EV manufacturers to open stores in CT might induce the legacy carmakers to compete in the showroom and not the legislature.


R.I.P. Volt

Goodbye, Volt

There are lots of sad (and angry) looking emojis in the very active Facebook community of Chevrolet Volt owners. It’s official: the Volt will soon pass into history. General Motors announced a round of cuts this week that will result in approximately 14,000 lost jobs and the closure of 5 manufacturing plants in North America. The Volt is assembled in the Detroit-Hamtramck plant and production will cease in March 2019. There are no plans to move Volt production to another facility.

Volt History

Launched in 2010, the Volt was a path-breaking plug-in hybrid design with category-leading electric range and a back-up gasoline engine which acts as a generator to power the electric drivetrain. It was named North American Car of the Year in 2011. It boasts high user ratings and, presumably important, was one of GMs more effective “conquest vehicles,” meaning that Volt purchasers were less likely to have been previous GM customers than purchasers of other models.

Given a range-improving refresh with the 2016 model-year, the Volt is rated for 53 miles of battery range, plus another 370 miles at 42 MPG on gas. The average interval between gasoline fill-ups has been reported to be about 2 months, meaning this vehicle racks up a lot of electric miles while avoiding range anxiety.

Volt Sales

The car has had respectable sales in the context of what EV models normally get, though after GM introduced the BEV Bolt, sales have slid. The Volt and Bolt have comparable sales at this point. According to Inside EVs, the Volt is the 5th highest selling EV over the first 10 months of 2018. (The Bolt is number 6). It averages roughly 1400 units per month, down considerably from its high-water mark in December of 2016 when it moved 3691 units.

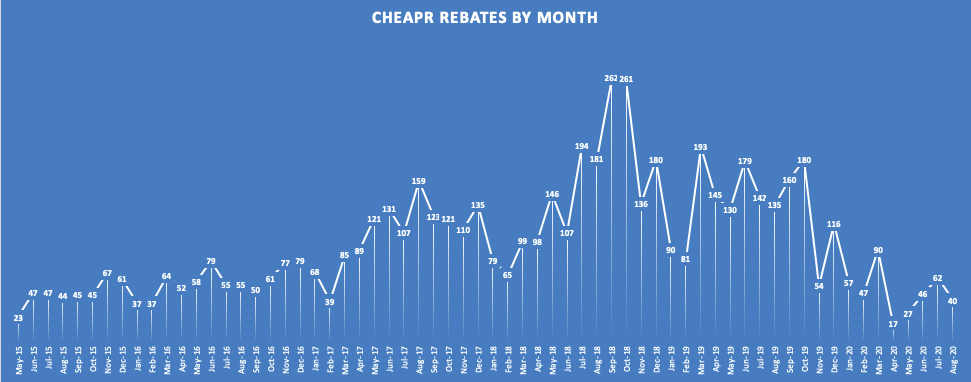
The vehicle has a presence here in Connecticut as well. It accounts for 21% of all of the rebates handed out as part of the CHEAPR program (through Sept 30, 2018).

CHEAPR Rebates

As of March 2018, the data point used in the most recent EV Dashboard published by the club, the Volt represents the second most widely registered EV in the state after the Tesla Model S, accounting for about 19% of all EVs in CT. (Deliveries of the Tesla Model 3 had barely commenced as of March.)

EV Dashboard - CT Registered Vehicles by Make

GM’s Decision

An important question is what can be read into this action by General Motors beyond cost-cutting, and the signals are not altogether clear. A sentence from reporting done by the NY Times reads that GM “said the move would ease the burden of spending billions of dollars to develop the battery-powered vehicles of the future.”

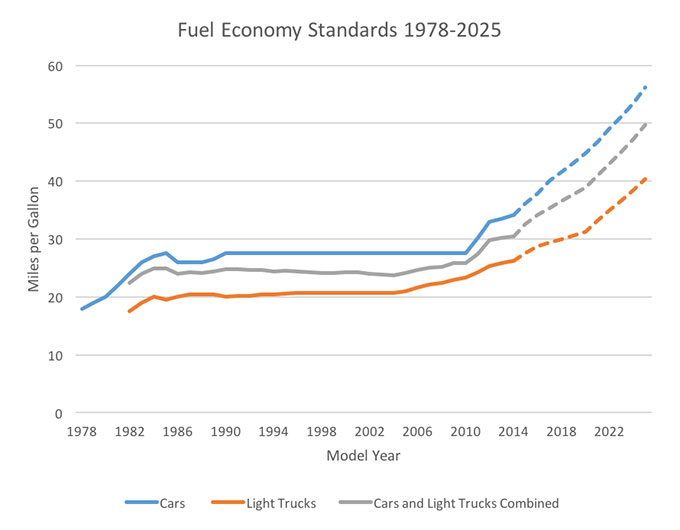
GM has always talked a good game about vehicle electrification, and they’ve developed some great technology. On the other hand, many in the Volt community feel that the company’s support of the Volt was tepid at best. And GM was one of the automakers that lobbied the Trump Administration to back away from the second phase of the CAFE mileage requirements that the industry had agreed to during the Obama Administration.

There is also the matter of the tax credit. GM is poised to cross the 200,000 EV unit sales threshold this quarter, becoming the second EV manufacturer after Tesla to do so, and faces having to sell electric vehicles absent the Federal Tax Credit once the phase-out period is over. There is a proposed bill in Congress that would extend the credit and remove the manufacturer cap. There is also a competing bill that would eliminate it altogether. It could arguably help Tesla and GM (or at least avoid them being competitively disadvantaged) if it were killed, though those of us in the EV community are hoping for the removal of the cap.

Gas Prices/Business Context

We have been in a prolonged period of relatively low gasoline prices. The chart below from Gas Buddy shows that while they are not at their lowest point in recent memory, they are still low and generally stable.


As we have seen in the past, low gas prices (ahem) fuel the consumer preference for SUVs and crossovers. And with these cuts, GM is following recent actions by Ford and greatly diminishing its passenger car offerings. This may have consequences down the road when prices inevitably spike at some point and consumer demand shifts to more fuel-efficient vehicles.

Business Insider published an article about the Volt in May of 2016, after the release of the Gen 2, which had great things to say about the car. To quote one sentence, “If you think it through, the Volt is…perfect!”

And yet here we are, arguably in a perfect storm of softening vehicle sales, a policy vacuum at the Federal level, tariffs raising the cost of production, a disappearing tax credit, and a manufacturer with a seemingly hedged strategy when it comes to EVs.

For now, all we can do is wait for the movie: Who Killed The Volt.


Leo Cirino Steps Down as Club President

Leadership Transition

Club founder, Leo Cirino, has stepped down as club president. Leo was widely recognized for his tireless and effective advocacy for clean transportation and received multiple awards from area organizations. Leo will be the first club President Emeritus and was presented with a plaque during the club news conference of April 21. The new club president is Bruce Becker. ​

Bruce Becker presenting a plaque to Leo Cirino

Leo, who is a forward-thinker when it comes to clean transportation and vehicle electrification, founded the club in 2009, the first EV club in Connecticut. During his tenure, the club worked on numerous projects to showcase EVs, educate the public, and develop charging facilities. It could be why Westport has the highest EVs per capita of any town in the state.


June 13: Ribbon-cutting for Largest EV Charging Station in Connecticut

A ribbon-cutting for the largest cluster of charging stations in Connecticut will be hosted by the Electric Vehicle Club of Connecticut, Connecticut Fund for the Environment, and the Connecticut Electric Vehicle Coalition on June 13, 2018, at 5:00 PM in Hartford. This event is open to the general public.


777 Main Street in Hartford is a LEED Certified Platinum building with 285 apartments and 40,000 square feet of commercial space. The development includes a total of 29 EV chargers: six Tesla superchargers, eight Tesla destination chargers, eight Clipper Creek level 2 chargers, and six level 2 and one level 3 DC SAE combo ChargePoint chargers.


A reception and panel discussion of EV policy in the Penthouse of 777 Main will follow, from 5:30 to 7:00 PM. Moderator and panelists:

  • Claire Coleman – Energy and Environment Attorney at CT Fund for the Environment
  • Matt Macunas – Legislative Liaison and EV Policy Specialist at CT Green Bank
  • Kerri Enright Kato – Director of DEEP’s Office of Climate Change
  • Emily Lewis – Policy Analyst at The Acadia Center

Subject to interest and time, an EV “ride and drive” will be available. An array of new electric vehicles are expected, including BMW, Nissan, Chevrolet, Tesla, and Honda.

About 777 Main

777 Main was designed and developed by Becker and Becker. Principal Bruce Becker, also the president of the Electric Vehicle Club of CT, stated, “80% of EV charging is done at home. Residents of apartments and condos typically have less access to charging, which is a significant barrier to ownership for a lot of people, especially in cities. The ambitious emission-reduction goals set by the state underscore the importance of increasing the number of EVs from the 6,264 registered as of March. This project in Hartford, CT serves as an example for adding charging features in housing developments as an impetus to accelerate EV adoption.”


WeGreen Westport Award Given to WECC

Westport First Selectman Jim Marpe presenting certificate to Leo Cirino, President of the WECC.

From left to right: First Selectman Jim Marpe, Barry Kresch of WECC, Leo Cirino of WECC, and Clarinda Higgins, an awardee from the Sherwood Island State Park Nature Center.

Photo credit: Dave Matlow, Westport Now

The Westport Green Task Force named the Westport Electric Car Club as one of its 2014/2015 WeGreen Westport Awardees. The club was one of 5 recipients.

The WeGreen Award is given to those individuals, businesses, or organizations who contribute to making Westport a more sustainable community. The WECC was recognized for its work with the town to develop EV charging station infrastructure (9 charging stations to date), and for staging an annual EV Road Rally promoting the benefits of EV ownership.

The ceremony took place at Wakeman Town Farm as part of the Westport GreenDay activities.

For more details and a complete list of award recipients, our friends at Westport Now provide the full story.