Are We There Yet?

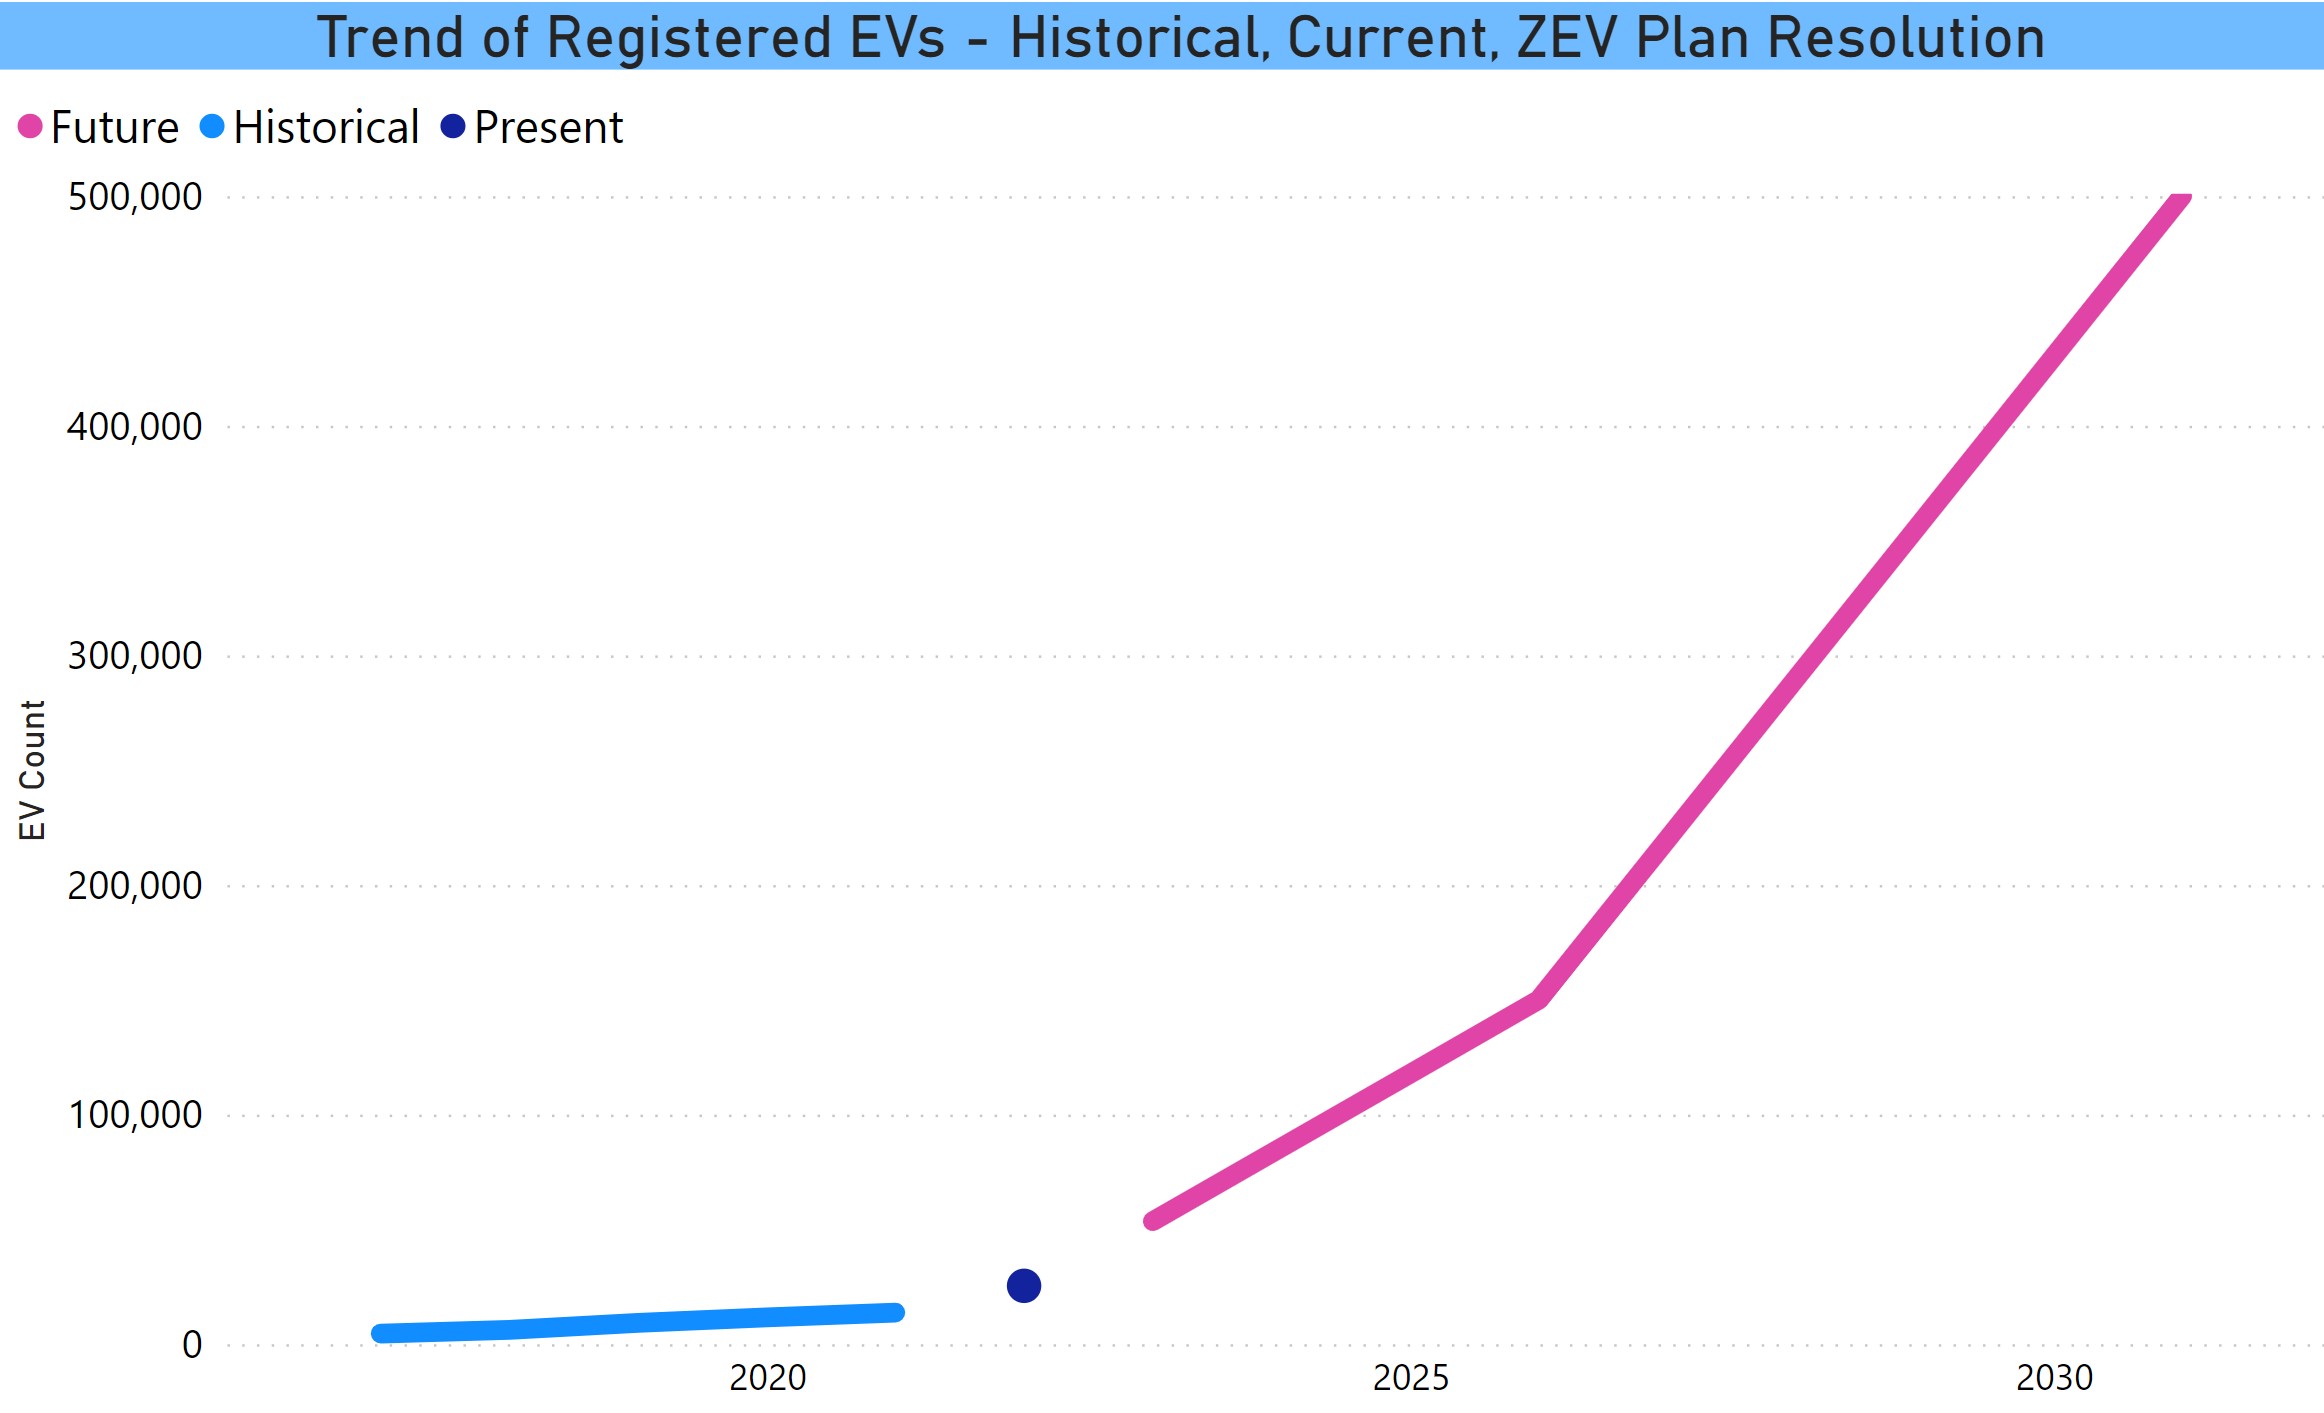
What Is the Progress Toward the Goal in the ZEV Plan

This has been quite a year for EVs – a major revamp of the federal incentive, an improved CT CHEAPR program, utility incentives for charging, a federal infrastructure bill providing over $50MM to CT to support a public EV charging station build out along major highway corridors, and most importantly, increased consumer interest. Unfortunately, there have also been supply chain disruptions and chip shortages leading to higher costs and a lack of inventory. Tesla and Rivian raised prices. Tesla blamed missing its Q3 delivery target on snaggled logistics. Many dealers have been charging a “market adjustment fee”, i.e. raising the price above sticker, sometimes way over sticker, or trying to force consumers to buy options they didn’t order. Dealers aren’t keeping demo vehicles on the lot because they are selling whatever they get their hands on. Consumers report waiting for long periods to get their vehicle. And finally, while we welcome the removal of the manufacturer cap in the revised federal incentive, it looks like it will create confusion for the first year or 2 with its complexity and uncertainty with respect to manufacturers aligning their manufacturing to meet the requirements.

So where does that leave us? We are up to 25,444 EVs (defined as BEV, PHEV, along with electric motorcycles and fuel cell). That is how it is defined at DMV and what is published on its website. This is a July 1 number.

EV Trend 2017 - July 2022


The state has established a goal of 500,000 EVs registered by 2030 with an interim goal of 125-150,000 by 2025. This comes to us via the Multistate Zero Emission Vehicle Action Plan Memorandum of Understanding. A lot of words for a non-binding document, but a useful yardstick for expectations, nonetheless. The chart at the top of the post represents where we’ve been (blue), where we are as of July 1 (dark blue dot), and where we need to be with the goals graphed on a straight line basis (magenta line). We need substantial increases every year, order of magnitude of 50% in net registrations. This is the turnover over the past year, the equivalent of roughly a quarter of acquisitions. That means sales (new + used) need to increase about 75% annually to get to that net figure.

For whatever reason, one of the questions we always get is how many fuel cell vehicles are registered. 6.

Turnover Jul 22 v Jul 21

We have recently been close to that but it becomes a taller order as the baseline gets higher. Growth over the past year is about 48% (25,444/17,217), but the pace fell in the past 6 months to a level below the same period one year ago. We should ideally be overachieving at this stage.

% Growth by 6 Month Intervals thru July 2022

There is momentum, but it has yet to be manifest in the numbers. It is important to keep in mind that the steep percentage increases required to meet the goals will be a greater challenge as the baseline increases. And it may take another year to assess true demand levels.


Mid-Year 2021 Dashboard Update

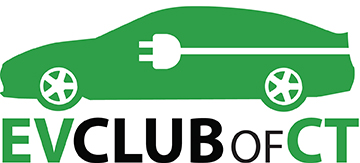
July 1 EV Registration Data

Post by Barry Kresch

Overall Trends

Following an earlier blog post updating topline registration data, I have now been through the details and will cover them over the course of several more posts.

As earlier reported, total electric vehicle registrations now total 17,217. This represents an increase of 36% over July 2020.

Trend of Registered EVs in CT 2017 - July 2021


Definitely an improvement, but we need more on a sustained basis. The glimmer of good news is that, not surprisingly, the bulk of the growth was recent. The last 6 months are growing at close to the pace we need. The chart below looks at semi-annual growth for the past 18 months.

% Change in EVs in CT by Period

Recent semi-annual EV growth CT

Fuel Type

Below is the trend by fuel type from 2017 through July 2021. For those new to the lingo, BEV = battery electric vehicle, PHEV = Plug-in Hybrid EV, BEMC = battery electric motorcycles, FCEV = Fuel Cell EV. BEVs have continued to outpace the other major category, PHEV.

BEVs outpaced the field. I will get into more detail in a subsequent post, but the big difference-maker was the Model Y. PHEVs, having been flat pretty much since the demise of the Chevy Volt, rebounded this year on the strength of two Toyota models: Prius Prime and the new RAV4 Prime.

When I have discussed the information on this project with reporters over the years, the first thing they ask is how many fuel cell vehicles there are. There are 3, as there have been. These vehicles are not currently available to buy in the state.

Fuel Type Change

Fuel Type July 21

Vehicle Body Type

A new field in the dataset this year is vehicle body type. An imponderable: Will I continue to receive it? The two pie charts below show the vehicles that were new to the file in first-half ’21 and all EVs as of July 1. So the vehicles in the first chart are included in the second and comprise about 25% of the total. With the Model Y and some other new models, the SUV percentage of the fleet is growing rapidly. 36% of the adds were SUVs, bringing the total file to 20%.

Vehicle Body Type


This probably understates how popular these vehicles are becoming. Keep in mind that this file is registrations and not sales. If I restrict the new vehicle chart to the most recent vehicles, MY 2021 and 2022, the SUV percentage goes to 44%.

MY 21, 22 Body Type

All data in this post come from the Interactive EV Dashboard, July 2021


Turnover Analysis – What EV Makes Are Moving Adoption

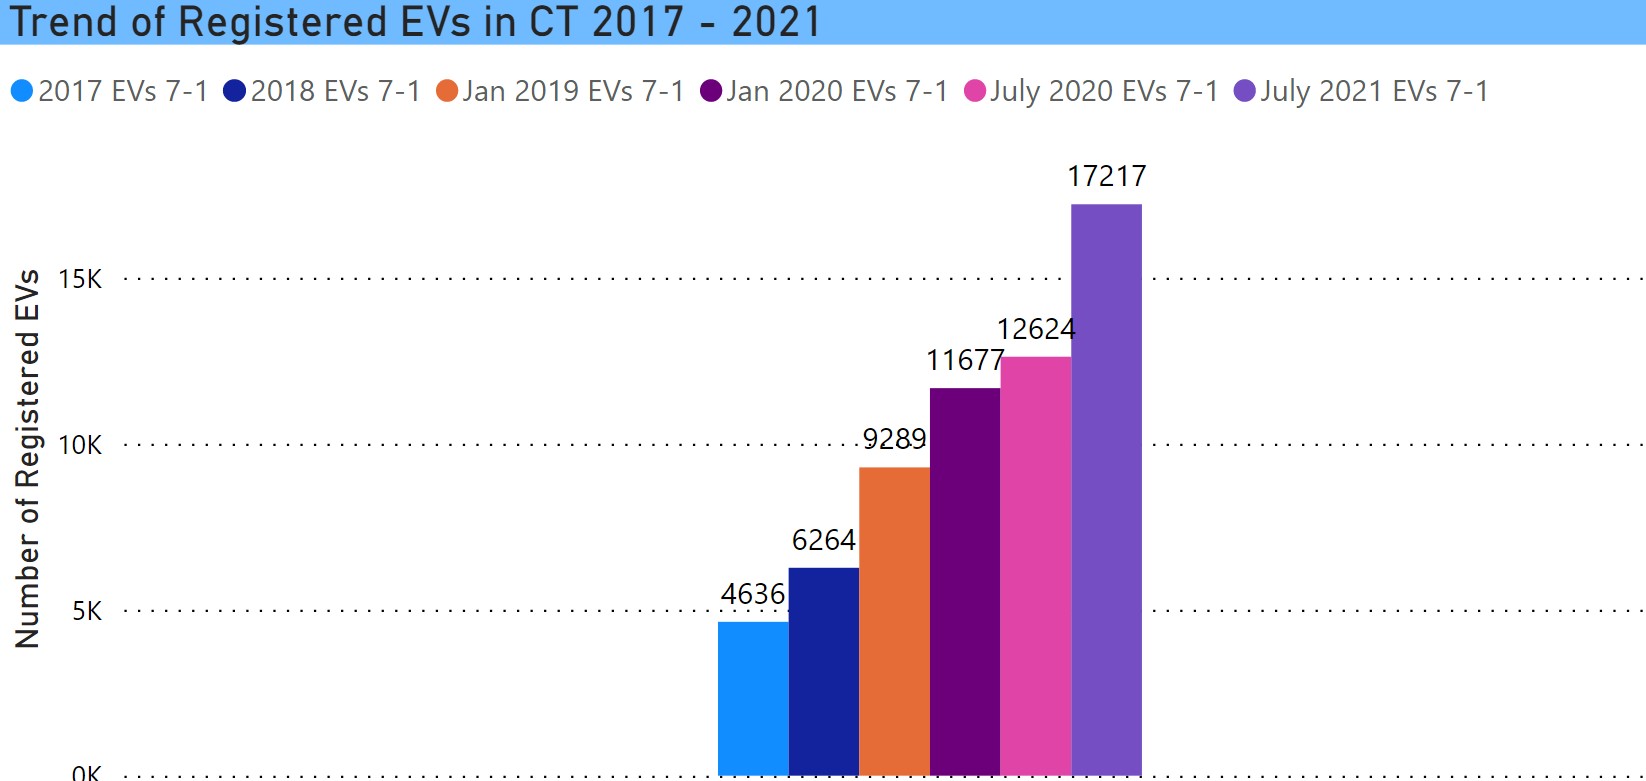
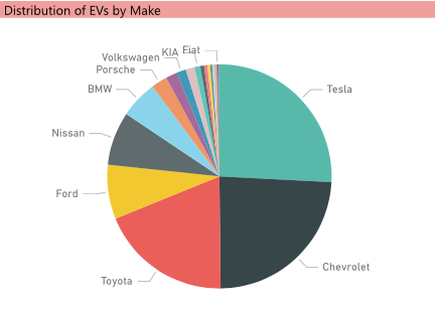
Turnover Analysis of EV Makes Driving Adoption

When we build our semi-annual EV dashboard with data sourced from the DMV, we, of course, look at trends by vehicle make. The analysis in this post is intended to give a more focused look at the recent impact of the various EV makes by isolating the vehicles that departed between January and July 2020 and comparing that turnover to the new vehicles added in the most recent July file.

The chart above shows that Tesla has low turnover, coupled with a high number of new vehicles added. That is not a surprising result. When analyzing EV adoption data, the answer to almost every question is “Tesla.” But the impact is seen more starkly in this view compared to the “trends by make” or “waterfall” charts in the dashboard. Since the outsized presence of Tesla tends to overwhelm everything else, it makes it hard to visualize any movement that may exist elsewhere. The answer: show the data without Tesla.


Turnover minus Tesla
Turnover by Make Minus Tesla

What pops on this chart is the contribution increase from Hyundai. This may be an early signal of a serious EV push, followed this past week by the announcement that Hyundai is spinning off its Ioniq marque into a dedicated EV sub-brand (like Volvo with Polestar) and plans 3 new EV model introductions over the next several years, beginning with a mid-sized crossover in 2021.

Toyota, which has occupied a distant number 2 position over the past couple of years with its Prius Prime PHEV, showed a smaller increase on a lower base.

Ford is going in the opposite direction, with more EV turnover than additions. They have an eagerly anticipated launch in 2021 of the Mach-E, a crossover that bears the iconic Mustang logo.

Audi, Land Rover, and Subaru also spiked, but the numbers were low. Audi showed 9 departures and 34 adds for its new e-Tron. Land Rover, just entering the plug-in world (and separate from the Jaguar iPace), went from having 0 EVs to 16. Subaru had one departure and 19 adds.


BEV Registrations Show 35% Increase Over Past 12 Months

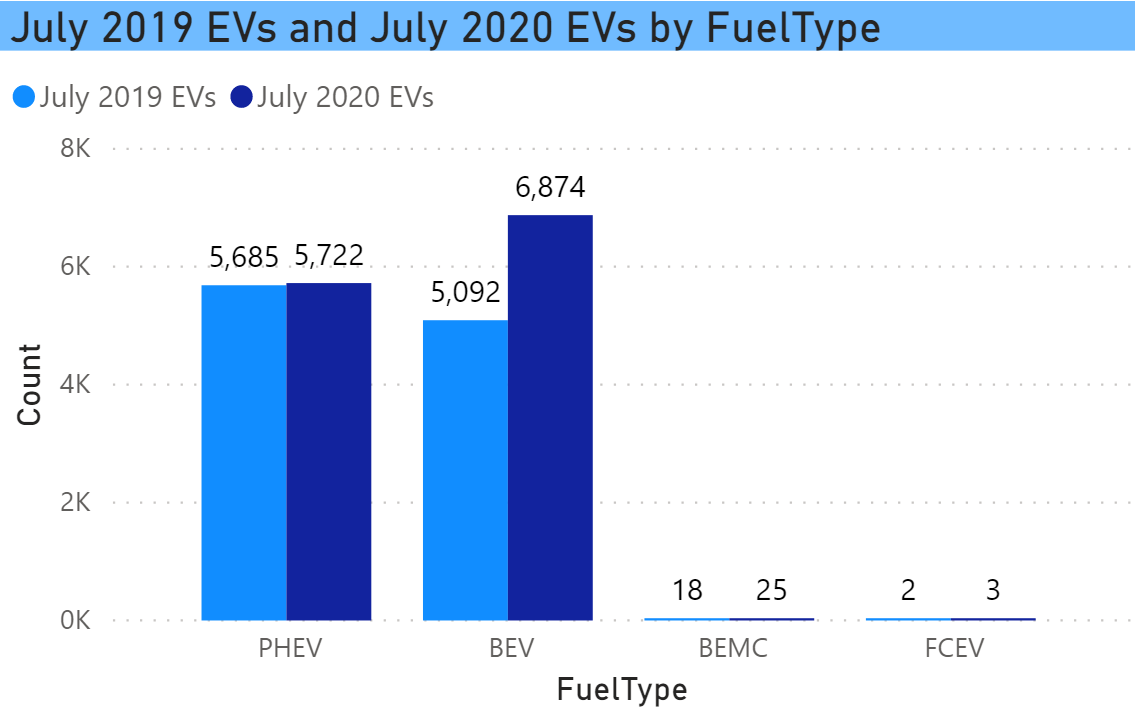
Fuel Type Trend

The mid-year 2020 update for the interactive EV Dashboard has been published. The relatively strong performance for BEVs contrasts with the change for PHEVs, which increased only 1% over the past 12 months. As of July 1, there were 6874 BEVs and 5092 PHEVs (along with 25 electric motorcycles and 3 fuel cell vehicles).

EV Fuel Type Trend in CT
Chart: Barry Kresch

This has been the recent trend, with PHEV growth leveling off beginning with the January 2019 data point (covering the 2018 calendar year).

Trend of Registered EVs

There are now 12,624 EVs registered in the state, as of July 1.


EV Unit Growth
Chart: Barry Kresch

While the overall EV growth was slower than we would like, the last 6 months, perhaps surprisingly since they included the pandemic, was similar to the prior 6 months. There have been reports of EVs suffering a smaller sales decline than the industry at large. The 16.9% growth rate of the past 12 months is almost exactly double the 8.1% of the last 6 months.

EV Growth Rate 2017 thru July 2020
Chart: Barry Kresch

Trends by Make

The pattern that we have seen over the last few iterations of the dashboard holds here, namely that Tesla is the big driver. This chart tracks the change in EV registrations by Make since 2017. It is an excerpt – all makes are available in the dashboard.

Trends by Make excerpt
Chart: Barry Kresch

Tesla now accounts for 40% of all registered EVs in the state with 5035 vehicles. (For charts in this blog post that do not display values, those can also be seen on the dashboard by hovering over a chart element.)

EV distribution by make
Chart: Barry Kresch

If we look at it from the perspective of the contribution of each make to the increase of the past 12 months, it is even clearer. This waterfall chart shows that Tesla was responsible for 74% of EV growth (all EVs, not just BEVs). Some manufacturers, as can also be seen in the trend chart, are seeing declines in net cumulative registrations.

Growth Contribution by Make
Chart: Barry Kresch

Trends by Model

When we drill into the individual models, it is the Model 3 that defines the picture. The growth of the Toyota Prius Prime (Prius Plug-in and Prius Prime are combined in these charts) has greatly slowed. The Model S and X have a steady, but not terribly large increase (and it is likely the Model 3 is cutting into sales of the S in particular). The Model Y has yet to make its presence felt with just 29 of them in the file. The Chevy Volt, once the most widely registered model in the state, has been discontinued. It has a presence in the used EV marketplace, but the overall numbers are showing a gradual decline. The Nissan Leaf is another major early EV that has slowed considerably in recent years.

The outlook for the rest of the year has to be characterized as uncertain. We aren’t close to being done with the pandemic and the bad economy. Manufacturers have delayed refreshes and new introductions until 2021. We are expecting significant refreshes for the and Bolt, the new Ford Mach-E, Rivian SUV and pickup, among others. The chart below is also an excerpt of individual model trends with the full chart available on the dashboard.

Trend by Model
Chart: Barry Kresch

Newly Registered EVs

This is the chart of EVs by Make registered in the past 6 months. Tesla accounted for 47% of all new registrations, which is why it’s current share has increased, and why BEVs are growing. There were a total of 1525 vehicles registered in the past 6 months. With a turnover of 578 vehicles, the net increase was 947.

Newly Registered EVs in CT
Chart: Barry Kresch

The increase we are seeing, assuming it remains similar for the second half of this year, is pacing below the necessary compound annual growth rate to meet the objectives of the ZEV MOU.

A word about the data:

The EV Club of CT has a standing Freedom of Information Act Request with the Department of Motor Vehicles. The DMV updates its census of EVs semi-annually, and when they do, they send us a file of the vehicle details. A reminder that this dataset is registrations, not sales. It includes new vehicle sales or leases, used EV purchases, people moving into the state who own EVs. We do not get the “denominator,” meaning all of the vehicles registered in the state, so we are not able to look at EV share of the total market.

The dashboard itself is interactive. Hovering over a chart element will display the value. The charts can be filtered by clicking in a chart element or by checking the boxes in the slicers. Multiple boxes can be checked. Please contact us if you have any questions.


R.I.P. Volt

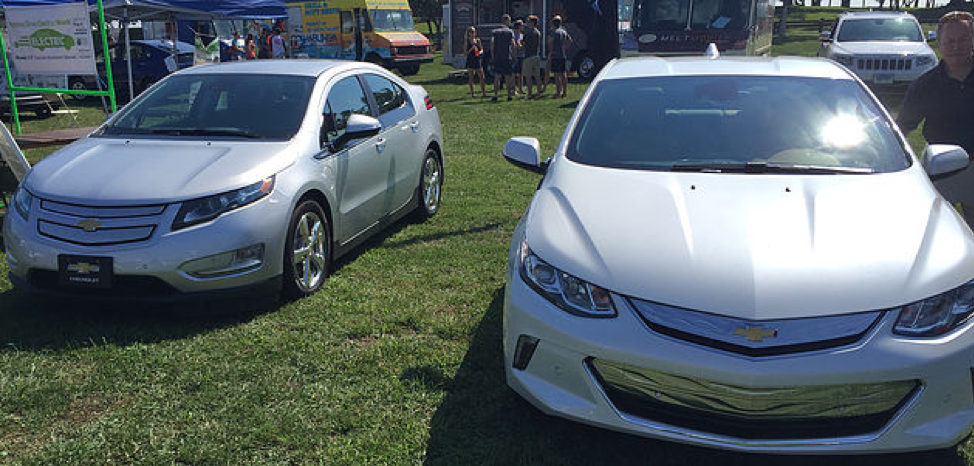
Goodbye, Volt

There are lots of sad (and angry) looking emojis in the very active Facebook community of Chevrolet Volt owners. It’s official: the Volt will soon pass into history. General Motors announced a round of cuts this week that will result in approximately 14,000 lost jobs and the closure of 5 manufacturing plants in North America. The Volt is assembled in the Detroit-Hamtramck plant and production will cease in March 2019. There are no plans to move Volt production to another facility.

Volt History

Launched in 2010, the Volt was a path-breaking plug-in hybrid design with category-leading electric range and a back-up gasoline engine which acts as a generator to power the electric drivetrain. It was named North American Car of the Year in 2011. It boasts high user ratings and, presumably important, was one of GMs more effective “conquest vehicles,” meaning that Volt purchasers were less likely to have been previous GM customers than purchasers of other models.

Given a range-improving refresh with the 2016 model-year, the Volt is rated for 53 miles of battery range, plus another 370 miles at 42 MPG on gas. The average interval between gasoline fill-ups has been reported to be about 2 months, meaning this vehicle racks up a lot of electric miles while avoiding range anxiety.

Volt Sales

The car has had respectable sales in the context of what EV models normally get, though after GM introduced the BEV Bolt, sales have slid. The Volt and Bolt have comparable sales at this point. According to Inside EVs, the Volt is the 5th highest selling EV over the first 10 months of 2018. (The Bolt is number 6). It averages roughly 1400 units per month, down considerably from its high-water mark in December of 2016 when it moved 3691 units.

The vehicle has a presence here in Connecticut as well. It accounts for 21% of all of the rebates handed out as part of the CHEAPR program (through Sept 30, 2018).

CHEAPR Rebates

As of March 2018, the data point used in the most recent EV Dashboard published by the club, the Volt represents the second most widely registered EV in the state after the Tesla Model S, accounting for about 19% of all EVs in CT. (Deliveries of the Tesla Model 3 had barely commenced as of March.)

EV Dashboard - CT Registered Vehicles by Make

GM’s Decision

An important question is what can be read into this action by General Motors beyond cost-cutting, and the signals are not altogether clear. A sentence from reporting done by the NY Times reads that GM “said the move would ease the burden of spending billions of dollars to develop the battery-powered vehicles of the future.”

GM has always talked a good game about vehicle electrification, and they’ve developed some great technology. On the other hand, many in the Volt community feel that the company’s support of the Volt was tepid at best. And GM was one of the automakers that lobbied the Trump Administration to back away from the second phase of the CAFE mileage requirements that the industry had agreed to during the Obama Administration.

There is also the matter of the tax credit. GM is poised to cross the 200,000 EV unit sales threshold this quarter, becoming the second EV manufacturer after Tesla to do so, and faces having to sell electric vehicles absent the Federal Tax Credit once the phase-out period is over. There is a proposed bill in Congress that would extend the credit and remove the manufacturer cap. There is also a competing bill that would eliminate it altogether. It could arguably help Tesla and GM (or at least avoid them being competitively disadvantaged) if it were killed, though those of us in the EV community are hoping for the removal of the cap.

Gas Prices/Business Context

We have been in a prolonged period of relatively low gasoline prices. The chart below from Gas Buddy shows that while they are not at their lowest point in recent memory, they are still low and generally stable.


As we have seen in the past, low gas prices (ahem) fuel the consumer preference for SUVs and crossovers. And with these cuts, GM is following recent actions by Ford and greatly diminishing its passenger car offerings. This may have consequences down the road when prices inevitably spike at some point and consumer demand shifts to more fuel-efficient vehicles.

Business Insider published an article about the Volt in May of 2016, after the release of the Gen 2, which had great things to say about the car. To quote one sentence, “If you think it through, the Volt is…perfect!”

And yet here we are, arguably in a perfect storm of softening vehicle sales, a policy vacuum at the Federal level, tariffs raising the cost of production, a disappearing tax credit, and a manufacturer with a seemingly hedged strategy when it comes to EVs.

For now, all we can do is wait for the movie: Who Killed The Volt.


Electric Vehicle Interactive Dashboard 2018 Update – 35% Increase in CT EVs

Updated EV Dashboard

The EV Interactive Dashboard is now updated. There are now 2 years of data represented in the model: February 2018 and March 2018. The data are a snapshot from these two points in time.

This comes to us from the CT Department of Motor Vehicles. Club President Bruce Becker filed a Freedom of Information Act to obtain it. The file includes every vehicle registered in the state of Connecticut.

A few words about the dataset.

There is no personal information. The fields that are given to us are make, model, model year, city, and fuel type. There is no plug-in hybrid (PHEV) fuel type in the file. We build that from the vehicle model. We then overlay census data that allows us to consolidate cities to counties, incorporate median household income by city, and calculate per capita stats.

To reinforce a couple of key points, the data in the file are not vehicle sales; it is the current vehicle fleet in the state of CT. It doesn’t matter if someone owns, leases, bought new or used. The year is the model year of the registered vehicle and should not be interpreted to be sales by year.

The model is interactive. The checkboxes are “slicers.” Checking a box will cross-filter all of the charts on that page. Similarly, clicking into a chart element will also cross-filter. You can click on more than one check box. If you are on a Mac, depress the command key while clicking. For PC, use the CTRL key. Hovering over a chart element will cause the value to display.

This model has multiple pages. The page bar is at the bottom of the screen.

Click here to spawn a web browser version of the dashboard

The browser version is a little balky, but such is life. If anyone has a PBI subscription and wants to see a PBI.com dash, send an email to WestportEVClub@gmail.com.

Look to upcoming posts to see our take on the highlights from the data set.