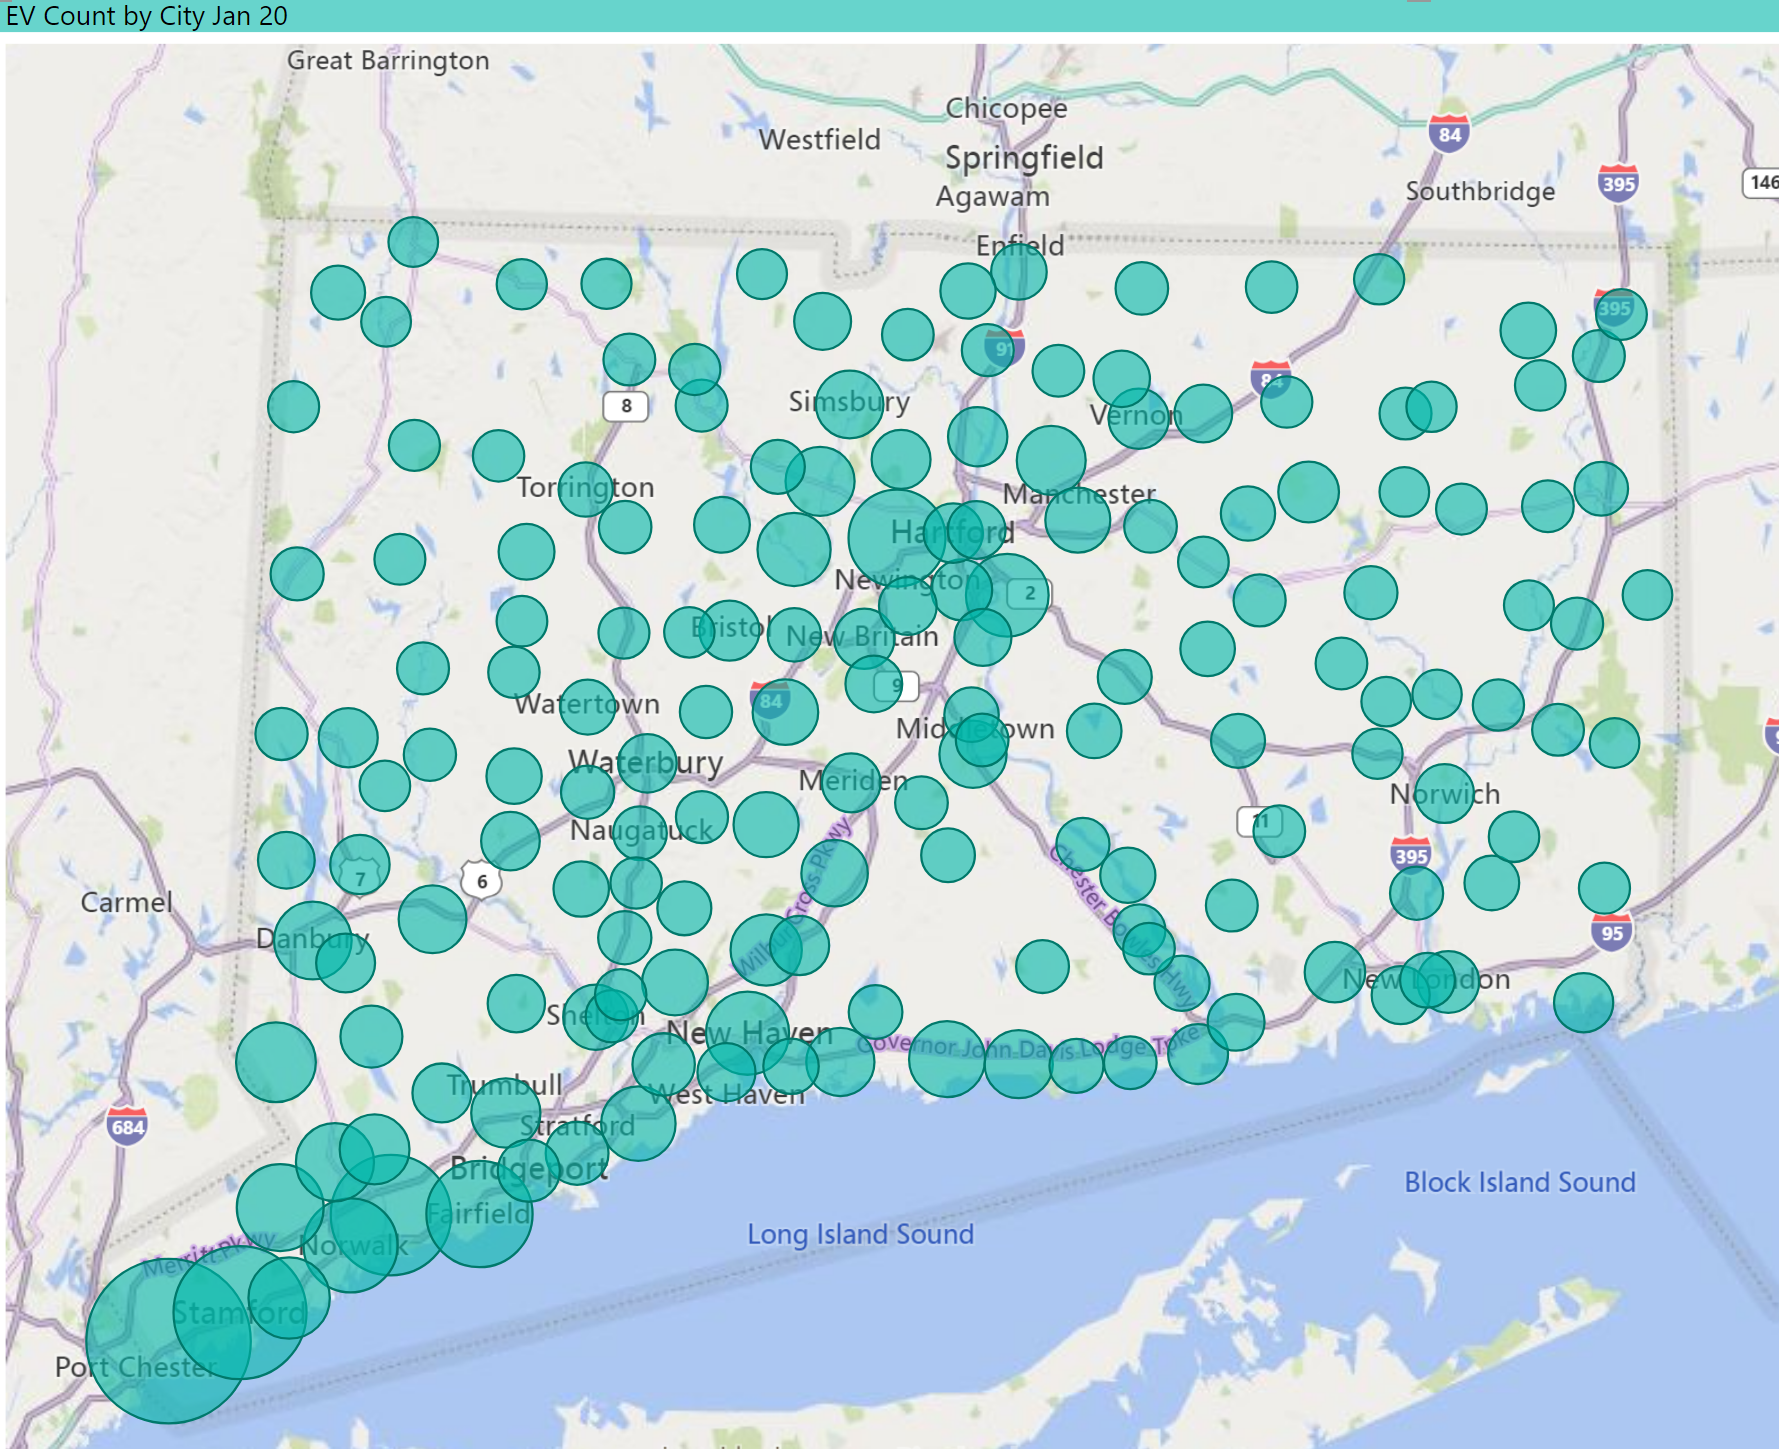
Dashboard – Where the EVs Are
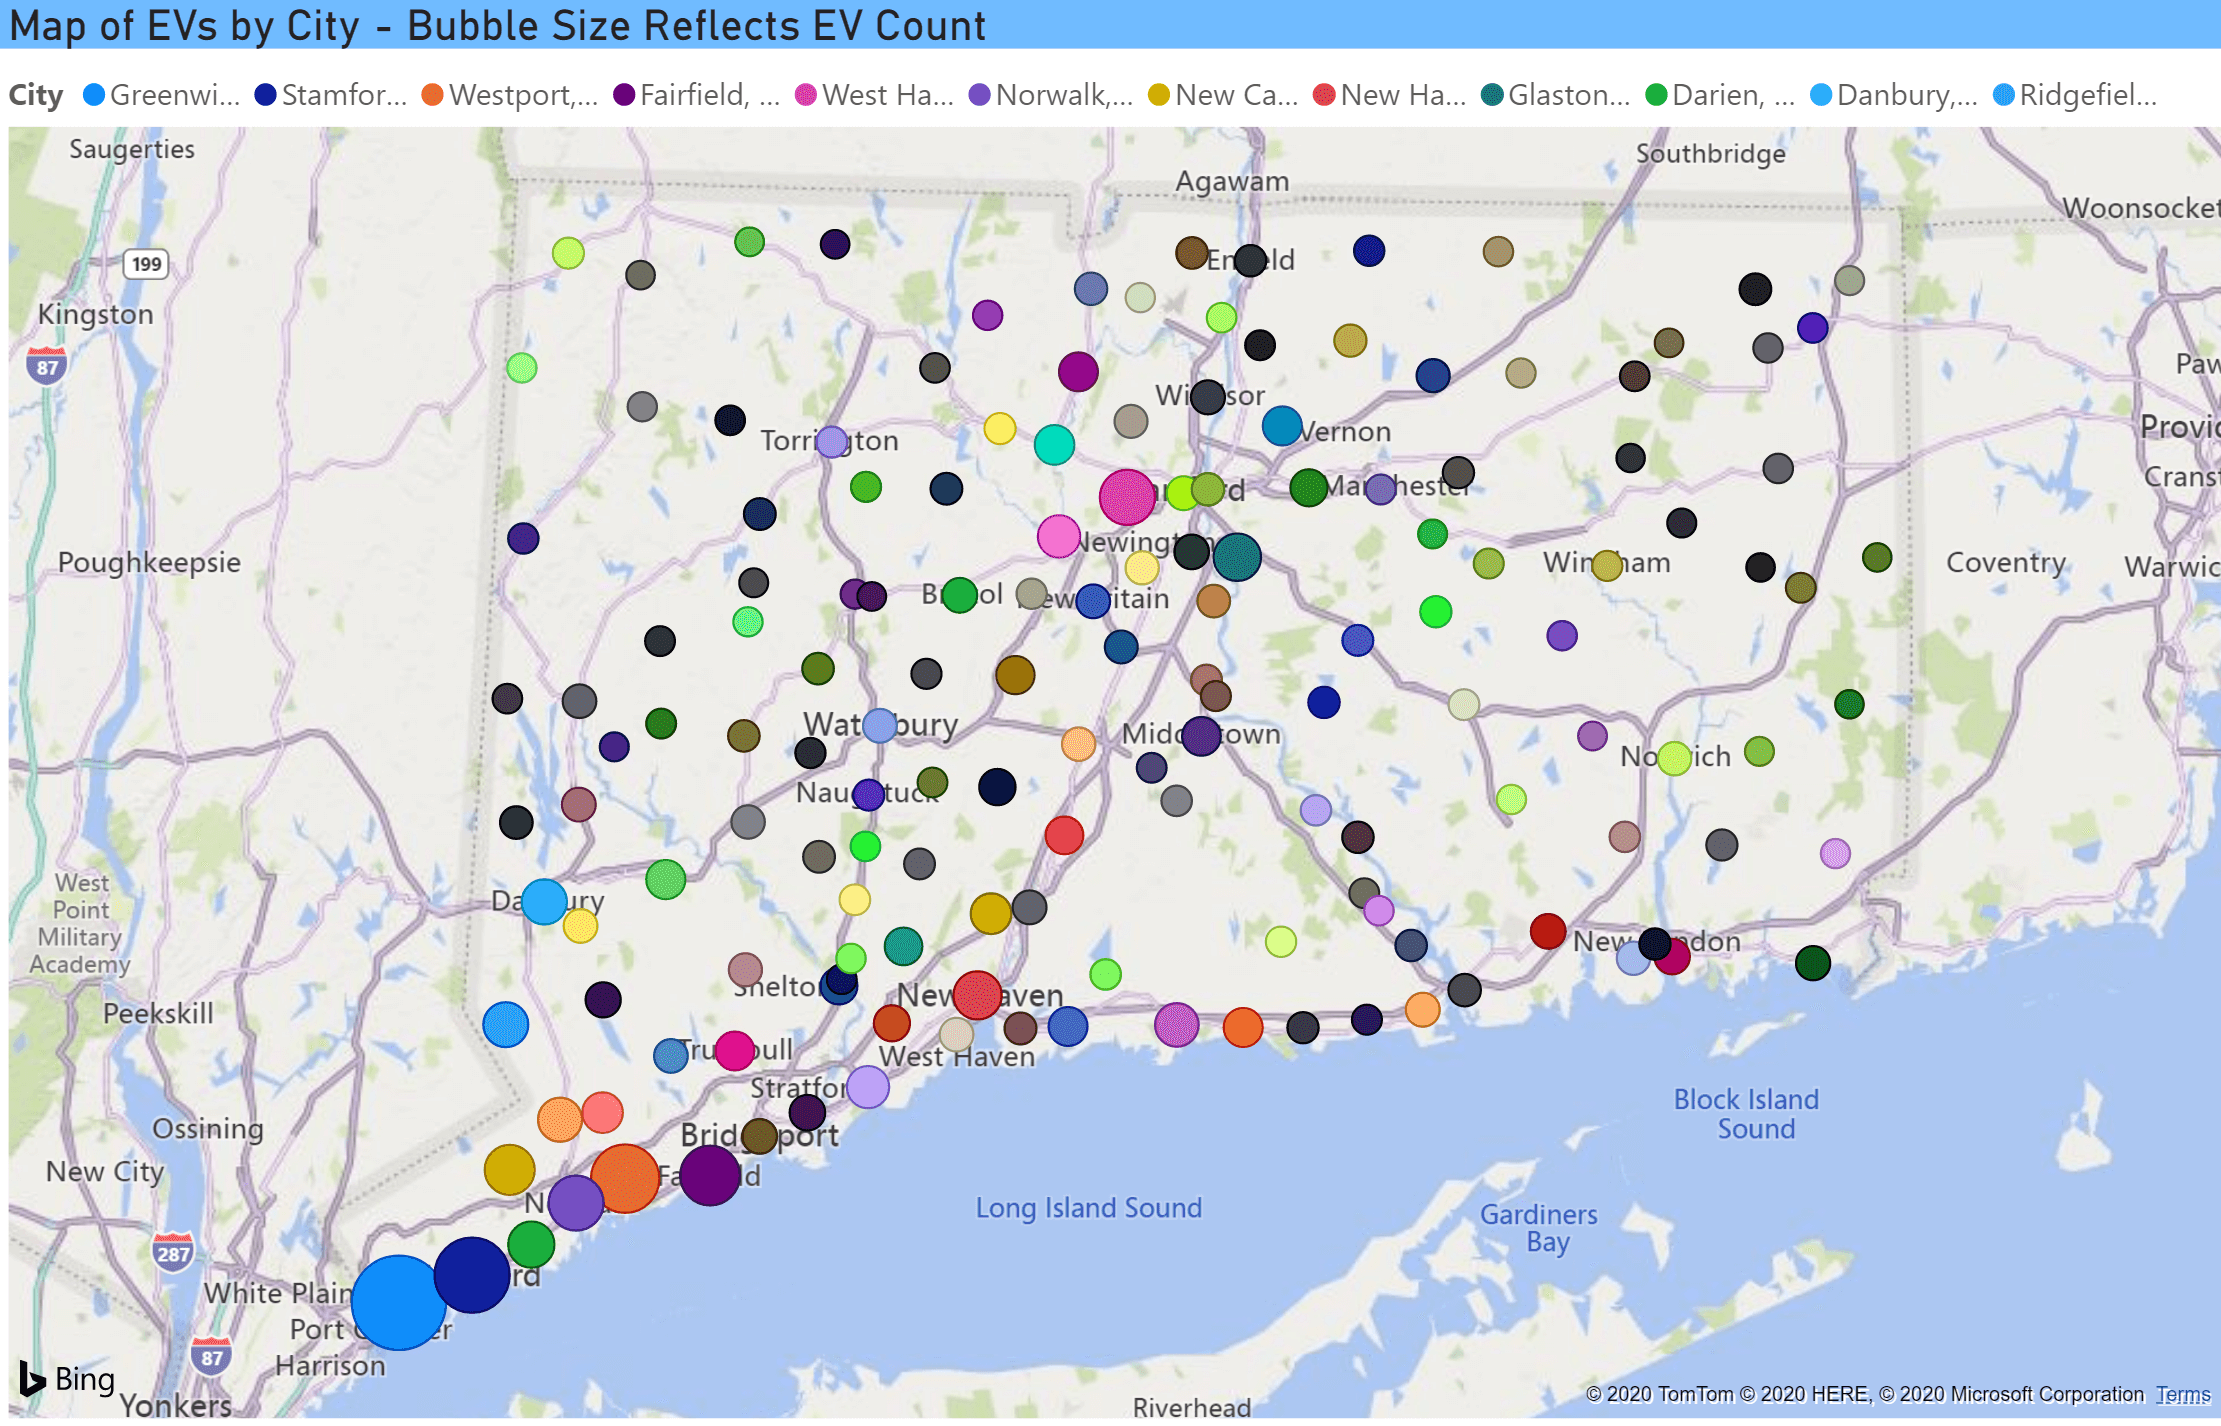
EVs are not uniformly distributed across the state Fairfield County has consistently tracked at around 40% of EVs in the state and is 41% in this July 1, 2020 iteration. This compares with its having … Read more