2020 – A Lost Year for CHEAPR
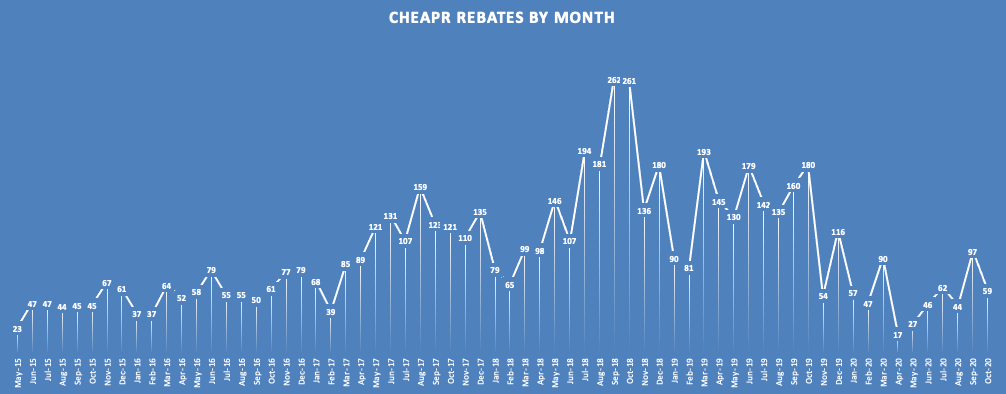
48% Month Over Month Drop in October Rebates Newly released data, updated with transactions through October 31, show a decline from September to October from 97 to 59 rebates. (The September number was restated and … Read more