Dashboard Redux – 2019

The newest version of the Electric Vehicle Interactive Dashboard has arrived.


Highlights

  • EV growth was strong in 2018 but there is still a very long way to go to achieve the objectives set forth in the Multi-State ZEV Action plan.
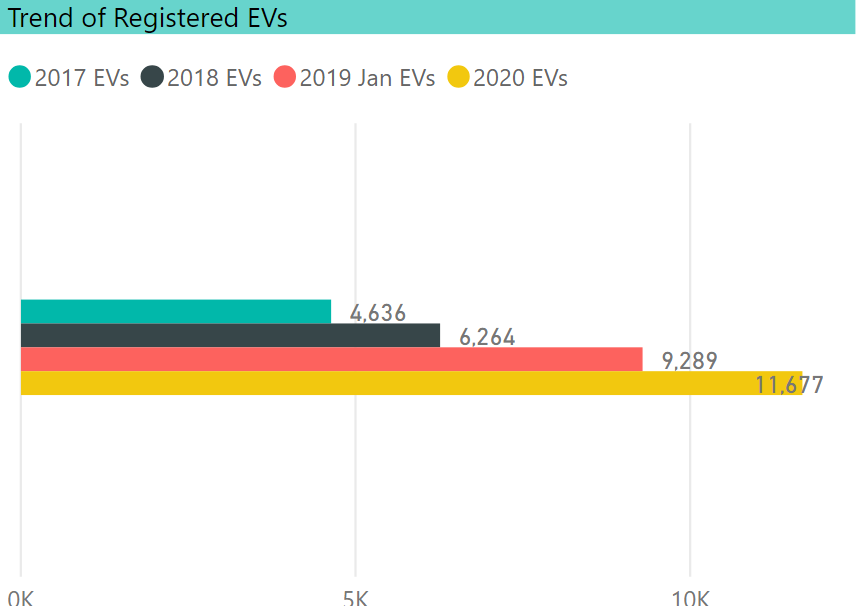
  • There are 9,289 registered EVs in the state as of Jan 1, 2019, an increase of 78% from the year ago point in time.
  • The increase was largely powered by the Tesla Model 3.
  • Plug-in hybrid vehicles (PHEVs) still account for somewhat more than half of all registered EVs.
  • The first fuel cell vehicles appeared in the state in 2018.
  • Tesla, despite only selling high-priced vehicles, including the higher-priced version of the Model 3, accounts for 31% of all registered EVs.
  • The most widely registered model is the plug-in version(s) of the Toyota Prius (combining the first-generation Plug-in Prius and the successor Prius Prime).
  • 61% of registered EVs are from the 2017 or 2018 model year.

Introduction

While the DMV is required by statute to publish the number of EVs in CT every six months, they do not publish any sort of breakdown. It is simply a topline number that can be used to measure the overall progress relative to the goals adopted when the state joined the Multi-state ZEV Action Plan (MZAP). Unless one has the financial wherewithal to subscribe to one of the syndicated research services that process automobile registrations, this is the only place to see the breakdown of electric vehicles in CT.

The Electric Vehicle Club of Ct (EVClubCT) has received files from the Connecticut Department of Motor Vehicles for the past three years, and from this we have developed the Interactive EV Dashboard. This blog post summarizes the findings. At the end of this post is information about how to link directly to the dashboard.

Technical Notes

These files have come to us via Freedom of Information Act request, but the timing, the included fields, and format have varied across the years. We work with it as best we can. For example, the file this year did not include fuel type. Even when it did, in 2017 and 2018, the DMV does not have Plug-in Hybrid Vehicles (PHEV) codified as a fuel type. We build that from the model name. The topline numbers published by the DMV do include all EV fuel types, which are Battery Electric Vehicles (BEV), PHEV, and Fuel Cell Electric Vehicles (FCEV).

We have received files from February 2017, March 2018, and January 2019 (actually all vehicles registered as of December 31, 2018). This asynchronous timing, along with our manually applying the fuel type designation, will cause our numbers to be slightly different than the DMV.

The dashboard is simpler this year because we did not receive the city associated with each vehicle, nor did we receive totals to give us a denominator. Consequently, we could not update our analysis by city, county, median income, per capita, and percentage of the fleet. We have make, model, and model year only.

Definitions

The numbers are based on vehicle registrations. NOT SALES. This is the most often misunderstood point about this exercise. In other words, it is cumulative minus any turnover. Vehicles may have been acquired new or used, purchased or leased. Also, the model year is exactly that, the vehicle model year – not the year in which it was sold.

Overall Growth

This blog has published in February that the number of registered EVs grew 78% year over year in 2019. The growth during the 9-month interval covered by the dashboard is 48%. Either number is an improvement over the 35% from the prior year. But the improved growth rate still leaves a big gap between the 9,289 EVs currently registered and the MZAP objective of about 500,000 EVs by 2030. We would need a going forward compounded annual growth rate of about 44% to achieve this level. The growth rate was relatively strong this year with the most significant factor being the pent-up demand for the Model 3.

Trend of EV registrations in CT

All of the charts below are from the data in the dashboard, which, as earlier noted, use months other than January for 2017 or 2018.

Fuel Type

PHEVs are still the more dominant fuel-type. At some point, we assume that BEVs will dominate and we note that General Motors has announced going forward that it will only produce BEVs. But the PHEV is an important transitional power-train. As noted by DEEP at their clean transportation forum on January 30, PHEVs have a big impact on reducing fossil fuels and will be with us for some time until infrastructure and battery technology can overcome range anxiety and limitations.

The first fuel cell vehicles have appeared in the file since we began doing this. There were – wait for it – drum roll — TWO! Both are the Toyota Mirai. Toyota, which is heavily invested in hybrids, seems to also be looking to develop FCEVs rather than BEVs. Their only BEV was the short-lived compliance vehicle BEV version of the RAV4. If you think EV charging infrastructure is inadequate, well, there are currently as many refueling options for FCEVs as there are vehicles. No waiting! When last we checked, there was one in Hartford and one in Wallingford. FCEVs are true zero tailpipe emissions vehicles (and like with electricity, there is a variable carbon footprint depending upon how the hydrogen is manufactured). The CT purchase incentive program, CHEAPR, offers a $5,000 rebate for FCEVs, larger than for the other vehicle types. Though there are complaints about the lack of EV charging stations, it is about the hardware and not the power source, as the grid is ubiquitous. That is the nature of the infrastructure challenge facing hydrogen power, along with the high cost of the cars.

EV Trend by fuel type

Make

Tesla, despite CT not allowing them to open stores in the state, has widened its lead, increasing from 26% to 31% of all registered EVs. 2,894 of the 9,289 EVs are Tesla. The only two other makes to exceed 10% in share are Chevrolet (19%) and Toyota (17%), with Toyota growing at a faster rate than Chevy. Below is an excerpt of the chart showing the 3-year trend by make, and below that, a donut chart showing the vehicle count as a share of the total.

EV trend by make

Share of EVs by Make

% Of Growth By Make

Tesla was responsible for 42% of the unit growth, followed by Toyota and Honda, both at 11%. The vast majority of automakers were responsible for less than 1% of the growth each.

EV growth year over year by make

Model

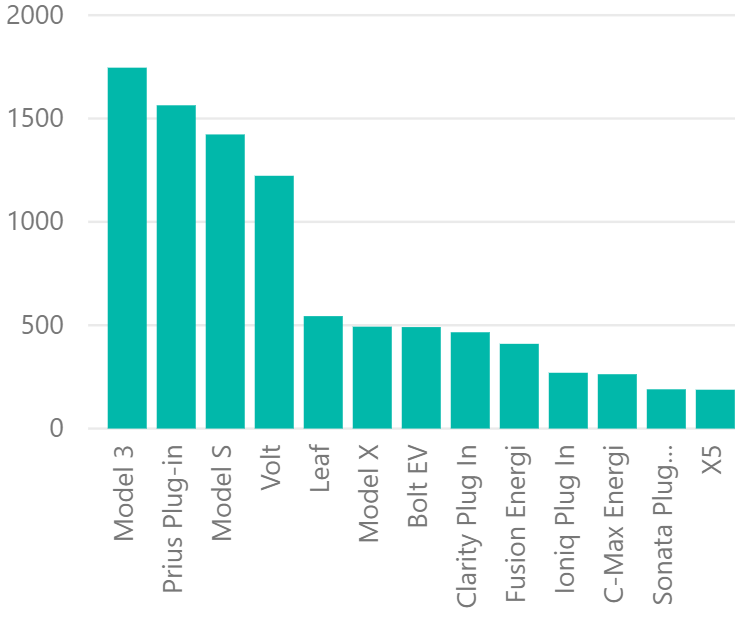
As noted earlier, the Model 3 was the big story, with 1,025 units registered in CT in 2018, placing it fourth in terms of number of vehicles registered following the Prius (1,533), Model S (1,413), and Volt (1,267). These are the only vehicles with over 1,000 registrations. The Leaf and Bolt follow. One other new car made a modest splash, the PHEV version of the Honda Clarity, now with 409 units registered in 2018. Below is an excerpt.

CT EVs by model

Model Year

It isn’t surprising that most EVs are of the 2017 and 2018 model years. There were a few 2019 models that sneaked in at the end of the year. If you look at the legend below, you might find it surprising that there is an EV from 1998. It is actually a Ford Ranger. That’s all we know. Is it some one-of-a-kind DIY thing? Or an error in the file (it happens)? We’ll leave it there.

EV Count by model year


Closing Thoughts

  • While EV ownership had strong growth in 2018, there is a long way to go to reach the MZEV goals.
  • Early signs are pointing to a slower growth year in 2019. EV sales nationally grew 11% in the first quarter of 2019 relative to 2018. (And in Q1 2018, the Model 3 had not yet scaled.) This compares to growth of 81% for the full year of 2018 over 2017. There are relatively few new near-term EV introductions. Among them are a refreshed Leaf with a 150 mile range, the Kia Niro rated for 239 miles, Hyundai Kona rated for 258 miles, 200+ mile luxury vehicles in the Audi E-Tron and the recently introduced Jaguar I-Pace. Tesla will begin producing the lower cost version of the Model 3 and may possibly offer a lease option later this year. Deliveries of the Model Y from Tesla, expected to be another significant launch, will not begin until late 2020, assuming it remains on schedule. GM has canceled the Volt, a fairly large seller by EV standards, and announced a pivot towards a BEV only strategy centered under the Cadillac brand which will take a few years to become manifest.
  • The EV Club was advocating for HB 7142, which would have permitted direct sales by a manufacturer without a dealer network (i.e. Tesla at this point in time). While Tesla’s announcement of a move to an Internet sales model has mooted this, the fact remains that this company has an outsize presence in the EV market in the state, though likely it could have been larger. This sales model may also be a consideration for prospective new entrants in the EV space.
  • There were a couple of other bright spots outside of Tesla, mainly the Toyota Prius Prime and the Honda Clarity (PHEV version, which has an electric range only slightly below the Volt), but most of the automobile manufacturers are not generating much EV sales volume at this time.
  • Both Tesla and GM are in the Federal Tax Credit phase-out period. Many of the newly announced EVs are a few years away from being available.
  • Fuel prices have remained fairly low.
  • There are a number of policies that the club advocates. Here are some important ones:
    • The CT CHEAPR rebate program does not have an ongoing source of funding and could run out this year.
    • We advocate the Federal Tax Credit be continued, preferably turned into a rebate, and that the 200,000 unit cap per manufacturer be removed.
    • Building codes should be updated to require pre-wiring for EV chargers, with particular attention to multi-unit dwellings.
    • Better time-of-use electrical rates.
    • Incorporation of EVs in public sector fleets.
    • Policies that de-carbonize the grid.
  • While there are some encouraging signals, including a study from AAA indicating that one in five drivers say they are likely to go electric for their next vehicle purchase, this is no time to take our foot off the “gas.”

The browser version of the dashboard is available here

There is a Powerpoint, obviously not interactive, of the dashboard visuals downloadable from the home page.

If any reader would like access to the PBI.com version, let us know via the website contact form.


EV Ownership In CT Increases 78% in 2018

The early data are in and the number of EVs registered in CT as of December 31, 2018 has increased by 78% relative to one year ago.

We do not have much detail below this high-level information, but we know a few things and can surmise more.

The total number of EVs registered as of 12/31 is 9289, up from 5206 one year ago. There were 5063 PHEVs registered and 4208 BEVs. (This doesn’t 100% tie back due to a few outliers). The PHEV number was up 69% and the BEV number was up 91% relative to 2017.

Even though we do not have granular data, we know that 2018 was the year of the Tesla Model 3. The large increase and higher proportion of BEVs relative to past years is no doubt due to the Model 3, which has blasted through all previous EV sales records. Our opinion is that this number is also possibly a bit understated. There is a lead-lag to getting a Tesla registered in CT due to the fact that it is still not legal for Tesla to open stores in CT. Consequently, Teslas must be purchased out of state and then the registration has to be transferred. We have one member of our club who was upset that the transference did not occur until after Jan. 1, which cost him part of his tax credit. It is likely he was not alone.

Below is a chart that shows the difference in EV sales by make in 2018 relative to 2017. It is based on analysis of national data published in Inside EVs.chart - change in EV unit sales by make

Our club is brand agnostic. We want to see people buy EVs and we don’t care which one they choose. The change for Tesla is obviously light years ahead of every other company. But the bigger point, or question, is about the lack of traction on the part of all of the other manufacturers. It looks like they aren’t really trying and we hope that can change. Almost all of them have made numerous and ambitious announcements of EVs in development. Audi has purchased a 60 second spot in the Super Bowl to advertise EVs. Based on the going rate, they will have spent over $10 million for the privilege.

The legacy automakers will argue that their inability to generate EV sales momentum is due to lack of consumer interest exacerbated by relatively low fuel prices. Tesla is demonstrating that this is not the case (and doing so with a form factor – a sedan – that has been falling out of favor with consumers).

When one sees numbers like these, and being aware of the aggressive EV adoption goals in the Multistate ZEV Action that CT has signed on to, it is hard to justify throwing up barriers that inhibit sales by Tesla or other companies which sell direct, such as Rivian, the maker of an electric pickup.

We hope that Audi is throwing down a marker, and we hope the other companies follow through in a serious way on their EV pronouncements. In the meantime, enabling Tesla and other new EV manufacturers to open stores in CT might induce the legacy carmakers to compete in the showroom and not the legislature.


Clean Transportation Forum in Hartford

Clean Transportation Forum in Hartford

These are the details of the upcoming forum:


Very Few Manufacturers Account for the Vast Majority of EVs on the Road

Very Few Manufacturers Account for the Vast Majority of EVs on the Road

While the growth of the number of EVs registered in the state of CT was a reasonably robust 35% from 2017 to 2018, there are actually very few manufacturers that account for most of them. These data were compiled as part of the Electric Vehicle Club of CT’s annual update of data obtained via a Freedom of Information Act request of the Department of Motor Vehicles.

As illustrated by the chart below, only 3 manufacturers, Tesla, Chevrolet, and Toyota, account for 69% of all EVs registered in the state.


Plugins Growth

Tesla is the largest with 26%, followed by Chevrolet with 24%, and Toyota with 19%. Recent trends only accelerated that. The growth from 2017 to 2018 was fueled by the same 3 companies which accounted for 73% of year on year growth. If one were to add Nissan, that grows to 80%.

The growth of Chevrolet was accelerated by the introduction of the BEV Bolt, giving Chevrolet two of the top-selling EVs including the PHEV Volt.

Toyota has met with success with its Prius Prime PHEV and that catapulted them from nowhere to third among all manufacturers in vehicles registered.

The big X factor is the Tesla Model 3. When this data set was generated in early March, very few had been delivered to customers in the state. Tesla stated that they have several thousand Model 3 reservations in CT as of early this year. And in August, the Model 3 alone represented roughly half of all plug-in sales nationally according to Inside EVs. We have seen many club members take delivery of this vehicle and fully expect that it will completely upend the current picture.

Let us remind ourselves that as of this writing Tesla is still not allowed to open stores in CT. Many manufacturers have announced ambitious EV plans. We hope they follow through. Our club is brand agnostic, but we support Tesla coming into the state. There is expected to be another attempt pass the necessary legislation to enable it when the next legislative session commences, and we ask our members and friends to reach out to their legislators to let them know there is a deep base of support for this.


Electric Vehicle Interactive Dashboard 2018 Update – 35% Increase in CT EVs

Updated EV Dashboard

The EV Interactive Dashboard is now updated. There are now 2 years of data represented in the model: February 2018 and March 2018. The data are a snapshot from these two points in time.

This comes to us from the CT Department of Motor Vehicles. Club President Bruce Becker filed a Freedom of Information Act to obtain it. The file includes every vehicle registered in the state of Connecticut.

A few words about the dataset.

There is no personal information. The fields that are given to us are make, model, model year, city, and fuel type. There is no plug-in hybrid (PHEV) fuel type in the file. We build that from the vehicle model. We then overlay census data that allows us to consolidate cities to counties, incorporate median household income by city, and calculate per capita stats.

To reinforce a couple of key points, the data in the file are not vehicle sales; it is the current vehicle fleet in the state of CT. It doesn’t matter if someone owns, leases, bought new or used. The year is the model year of the registered vehicle and should not be interpreted to be sales by year.

The model is interactive. The checkboxes are “slicers.” Checking a box will cross-filter all of the charts on that page. Similarly, clicking into a chart element will also cross-filter. You can click on more than one check box. If you are on a Mac, depress the command key while clicking. For PC, use the CTRL key. Hovering over a chart element will cause the value to display.

This model has multiple pages. The page bar is at the bottom of the screen.

Click here to spawn a web browser version of the dashboard

The browser version is a little balky, but such is life. If anyone has a PBI subscription and wants to see a PBI.com dash, send an email to WestportEVClub@gmail.com.

Look to upcoming posts to see our take on the highlights from the data set.


EV Ownership Grows 35% in CT

35% Increase in 2017

The number of plug-in vehicles registered in CT has grown by 35.1% in a comparison of 2 data points one year apart.

The Westport Electric Car Club received an updated vehicle ownership file from the CT Department of Motor Vehicles which was obtained via a Freedom of Information Act request. This enables us to make comparisons with a similar file acquired 1 year ago. These files contain no personal data, just make, model, model year, and city.


This translates to 6264 vehicles this year compared to 4636 the prior year. The term EV includes both battery electric vehicles (BEV) and plug-in hybrid vehicles (PHEV). EVs represent .28% of all vehicles registered in the state this year, up from .20% last year. EV sales have been growing by double digit percentage increases for several years now, but when looking at a number like .28% of all vehicles, the context is that these recently manufactured EVs are in a file that contains all of the existing fleet in the state.

Keep in mind that these data points are static snapshots of vehicles registered. It is not the same as new car sales. It would include the purchase of used vehicles and it would not include vehicles that were sold or had a lease expiry. Broadly speaking, since they aren’t the same numbers, this 35% increase compares with a 26% increase in the sales of new EVs nationally in 2017 vs. 2016. As this post is being written the March 2018 EV sales figures are being released. Inside EVs is reporting a record month, with EV sales up 43% compared to March 2017.

Makes

The most widely represented EV make in CT remains Tesla with 1617 vehicles, followed by Chevrolet with 1504 and Toyota with 1191.

Cities

With respect to cities, Greenwich remains the city with the most EVs at 511. Westport is third with 266, though it has the highest per capita incidence of EVs at 1%, roughly 3.5 times the incidence of the state as a whole.


One of the most frequent questions we got when we did our analysis last year was how many fuel-cell vehicles were in the file. The answer this year is the same as last year: NONE!


There were several new models represented this year, including the Honda Clarity PHEV, Chrysler Pacifica PHEV, and the Mini-Cooper PHEV.

Increases

The makes with the largest percentage increases among those with a major EV presence (arbitrarily defined as at least 300 units) are Chevrolet at 52.4%, Toyota at 51.9%, Nissan at 33.3%, and Tesla at 21.4%. The Chevy increase was driven by the introduction of the BEV Bolt. Toyota introduced the Prius Prime, the new version of its plug-in Prius which is selling much better than the previous model. Nissan is transitioning to the new Leaf.


The elephant in the room is, of course, the Tesla Model 3. Given that Tesla is the most widely represented EV brand in the state and given the fact that there is a backlog of unfilled reservations, if Tesla manages to wrangle its manufacturing bottleneck, it could change the complexion of the numbers. There were only 4 Model 3s included in this file. During recent testimony in Hartford, Tesla reported having over 3000 Model 3 reservations in the state. In Westport, Tesla represents 51% of all plug-ins and it accounts for 8.3% of all of the Teslas registered in the state. That projects out to something like 250-300 Model 3 reservations in Westport. In other words, if this is accurate, it represents a number roughly equal to all of the plug-ins currently registered in the town.


We won’t know for a while about the Model 3, but we will be following up with additional information from our analysis of the data and an update to our interactive dashboard. Stay tuned!


Interactive Dashboard, Part Deux: Westport Has Highest Incidence of EVs of all CT Cities

Interactive EV Dashboard

We have added a page to the CT EV interactive dashboard so that it now shows plug-in vehicles per capita by city and plug-ins as a percentage of all vehicles registered in each city.

Keep in mind that the denominator in per capita is the entire population and not just those old enough to drive.

Westport has the highest incidence in each case, though the low incidence, in general, illustrates the progress yet to be made.

This page has the same interactive features as the other pages and there is a slicer by fuel type in order to isolate the data view to either Electrics or PHEVs (plug-in hybrid).

Again, all data are based on vehicles registered as of February 2017. It is a static view and not to be confused with sales.

Here is the dash link.


The State of the State of EVs in Connecticut

EV Ownership Deep Dive in CT

Sales of EVs nationally have continued on an upward slope in 2017, up 44% year over year for the first 5 months relative to 2016. And the availability of models has come quite a ways since the 1898 Riker pictured in the photo above. 32 different plug-in models had sales, compared with 26 in May of 2016. New models that hit the market in late 2016 and early 2017 include the Chevrolet Bolt, a revamped Toyota Prius Prime, BMW 530e, and Mercedes C350e. Of these new introductions, the Bolt is a battery electric vehicle while the others are plug-in hybrids. And, of course, we await the Tesla Model 3, deliveries of which are expected to commence sometime in the third quarter of this year.

In this blog post, the WECC takes a deeper dive into the status of EV ownership in Connecticut.

Technical Information

The information in this post comes from the Department of Motor Vehicles and includes all plug-in vehicles registered in Connecticut as of February 2017. The data set contains no personally identifiable information, just make, model, model year, and city. There is a link to spawn the dashboard at the bottom of the post.

The list was procured by club member Bruce Becker via a Freedom of Information Act Filing. The dashboard was built by Barry Kresch.

Please note that this is a database of registrations which is not the same thing as sales. The year is the model year of the car, not when it was purchased or registered. This affected Chevrolet in particular because GM had a short run of the 2016 model year Volt and the 2017s were on sale in CT by the spring of 2016.

There are currently 4636 plug-in vehicles registered in CT. (There are approximately 2.3 million vehicles in total registered in the state, so, yes, you can still be an early adopter!) This number includes battery electric cars as well as plugin hybrids. Going forward in this post, these are simply referred to as “electric” and “PHEV” respectively. PHEV vehicles have smaller battery packs than electrics and can run on gasoline when the battery is depleted. They are sometimes referred to as “series hybrids.” PHEVs come in many different configurations in terms of how the engine works and the size of the battery pack. In other words, the saying “your mileage may vary” applies in a really big way, but you can at least bank it being high. There is one vehicle, the BMW i3 REX, which has a very small gasoline engine (about 3 gallons) which is an optional range extender intended for emergencies. For the purposes of this analysis, it is considered an electric since that is how it is intended to be used.

Highlights:

  • There are 30 models of electric/PHEV vehicles from 19 manufacturers registered in CT. Keep in mind that there are a number of EV models that have only been available on the West Coast as manufacturers play the zero-emission credit (ZEV) game to comply with the letter of the law for the California Air Resources Board requirements. Even some vehicles intended for a national market get rolled out gradually across the country (the Chevrolet Volt and Bolt both being examples).
  • The largest moniker in the state is Tesla, which accounts for 29% of registered plug-in vehicles (and 62% of electrics). Tesla is the leader even though the company is not permitted to have a sales showroom in CT. For the third-year running, a bill to enable Tesla to sell direct in CT did not make it through the legislature. (The legislative session ended on June 7.)
  • Chevrolet is second with a 21% share. This all comes from the Volt as the Bolt was not yet available in CT at the time the data was sourced. A third Chevrolet model, the SparkEV, is not sold in CT.
  • Toyota was the only other automaker above 10%. They came in at 17% with their Plug-in Prius and the newer version, Prius Prime.
  • The largest individual models were the Tesla Model S (24%) and Chevrolet Volt (21%).
  • The lion’s share of EVs is in Fairfield County with 46%. Hartford County and New Haven County follow at 18% and 17% respectively.
  • The cities leading in EV counts are Greenwich, Stamford, Westport, Fairfield, and Norwalk.
  • PHEVs represent 54% of the total.

The dashboard is interactive. There are 3 pages. Pagination is at the bottom. If you click into one of the checkboxes it will filter the data on that page to that box (or boxes). If you want to check multiple checkboxes, then depress the control key while clicking. (It is a little tricky to click multiple boxes on the web dash. It sometimes needs a double click.)  If you click into an element in a chart, it will cross-filter the other charts. If you hover over a pie slice or a bar, counts and/or percent share will display. See the dashboard here.

The dashboard is best viewed on a desktop/laptop computer. An example of one of the charts is in the screenshot below.

We hope you find it interesting!

CT Electric Vehicle Registrations by Make