Mid-Year 2021 Dashboard Update
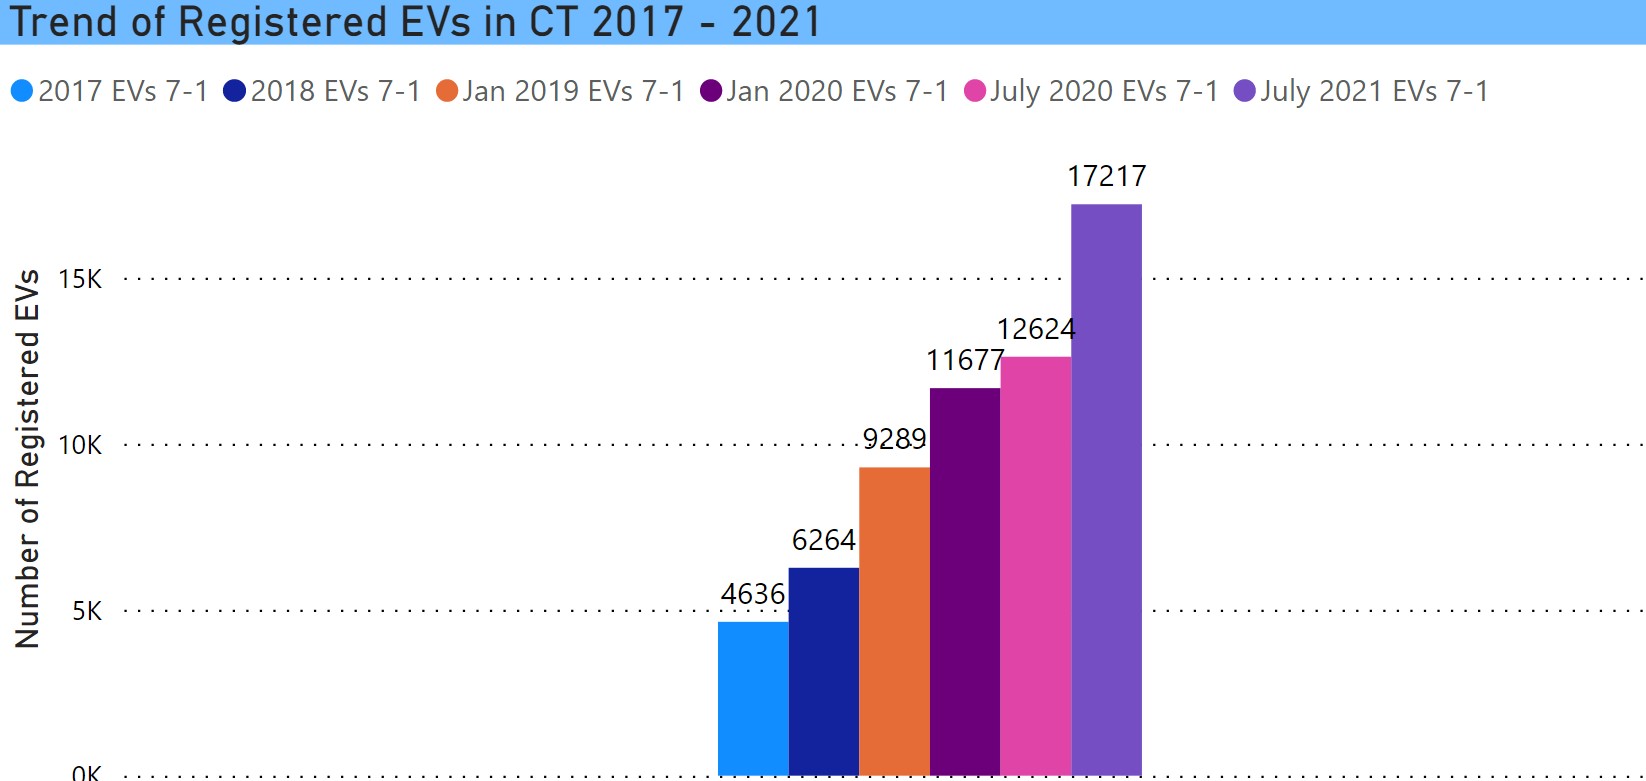
July 1 EV Registration Data Post by Barry Kresch Overall Trends Following an earlier blog post updating topline registration data, I have now been through the details and will cover them over the course of … Read more